Understanding Birdeye Reports: 'Review Reports'
Birdeye provides a robust report management system that helps you gain better insights into the data aggregated into your account. You can view data on reviews, platform usage, visitors, and more.
Outcomes Report
Users can view ready-made review reports in the ‘Outcomes’ tab to help easily track key metrics.
Click the ‘Outcomes’ tab and select ‘Reviews.’

The following metrics can be viewed and compared under the Reviews Outcomes report:
| Reviews Outcomes |
|
The default time period to view reports is ‘Last 12 months.’ To change it, click the time period.

Under the ‘Filter by’ tab, click ‘Last 12 months.’

Select the desired time period to view reports and click ‘Apply.’

Click ‘Compare period’ to compare the report data based on ‘Previous period’ and ‘Before Birdeye.’

Review Reports
Let's look at the type of reports available under 'Review reports'. The reports available under this tab are divided into categories mentioned below.
Note
The 'Relative location rank' reports are available for multi-location or enterprise accounts only.
Review & Ratings
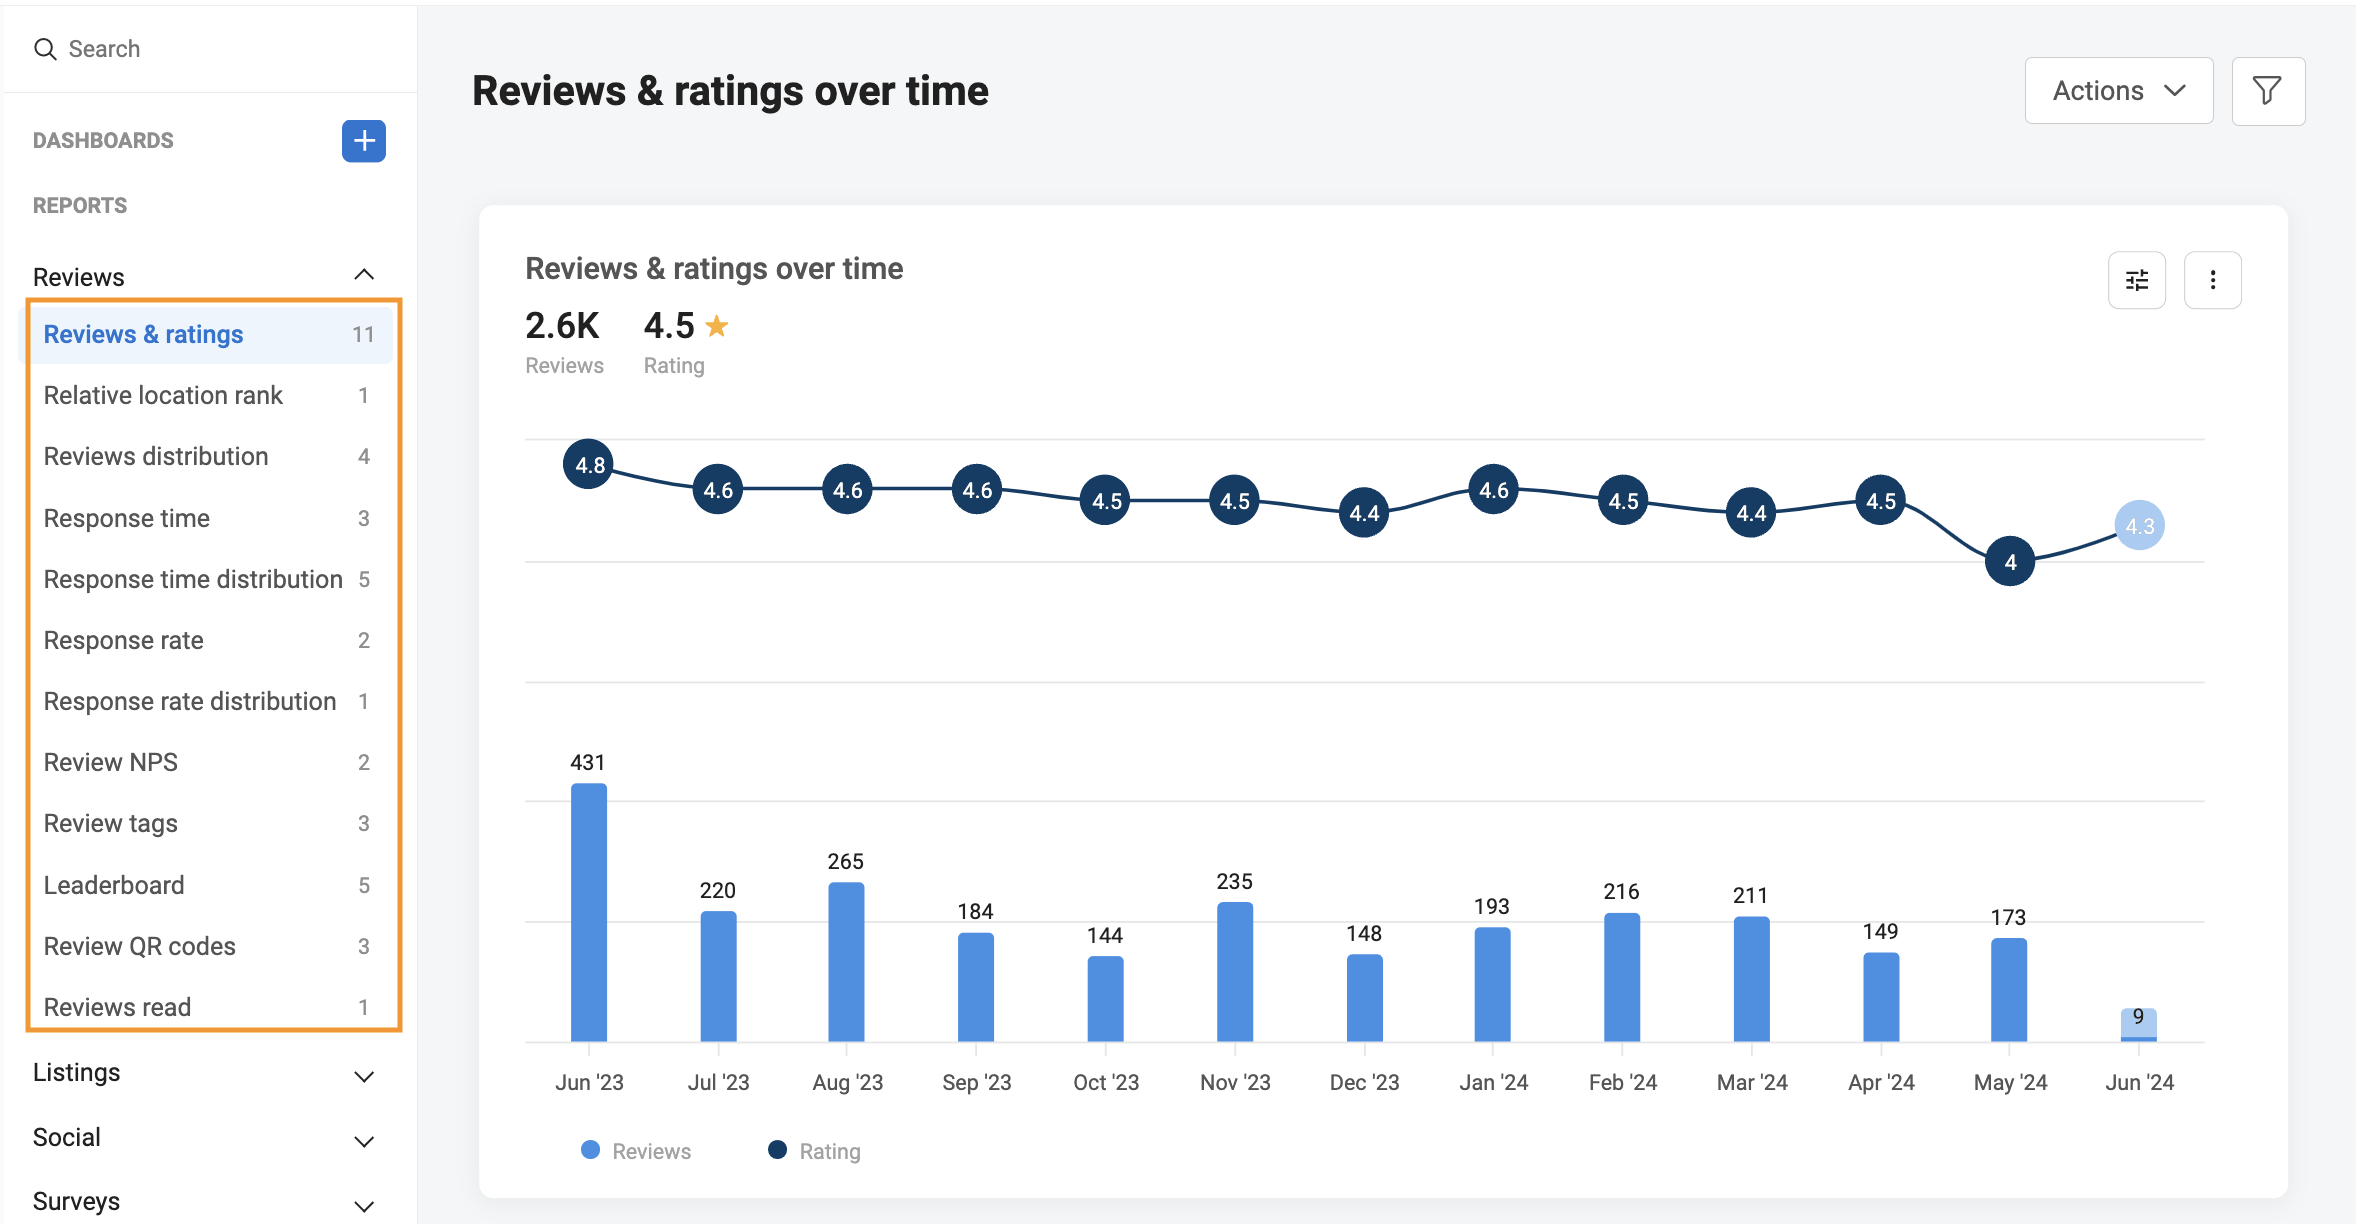
To view the 'Review reports,' click the 'Reports' tab on the left navigation rail of your Birdeye dashboard. Once on the 'Reports' page, you can view the following Review reports:
- Review & ratings
- Relative location rank
- Reviews distribution
- Response time
- Response time distribution
- Response rate
- Response rate distribution
- Review NPS
- Review tags
- Leaderboard
- Review QR codes, and
- Reviews read
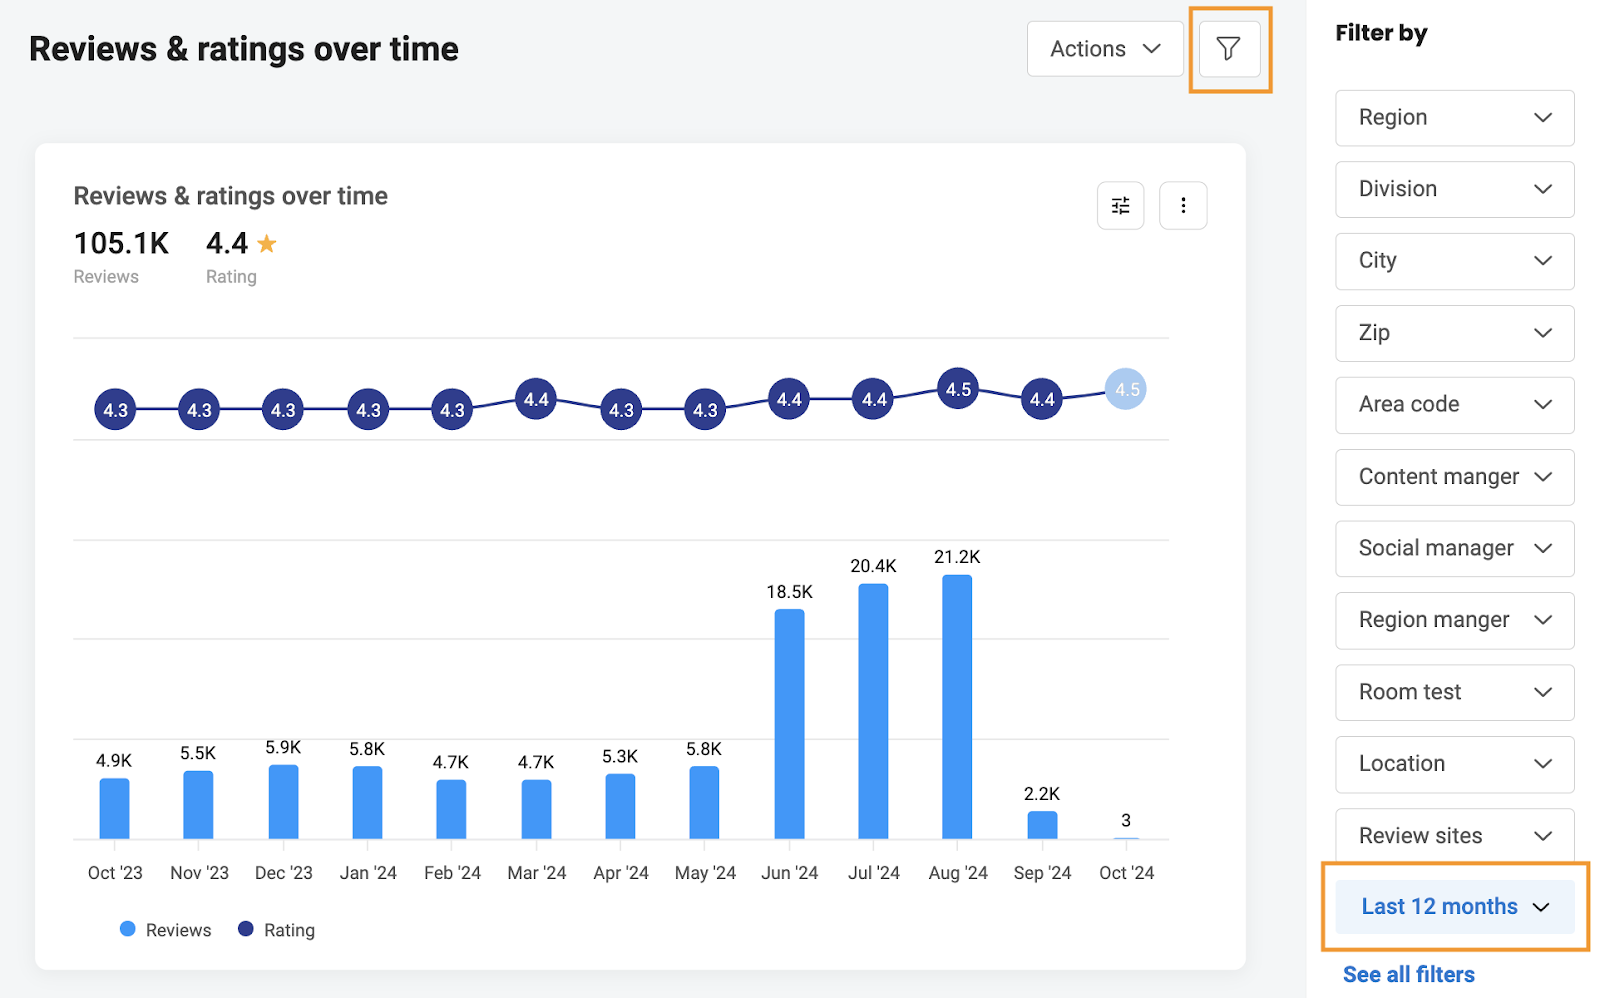
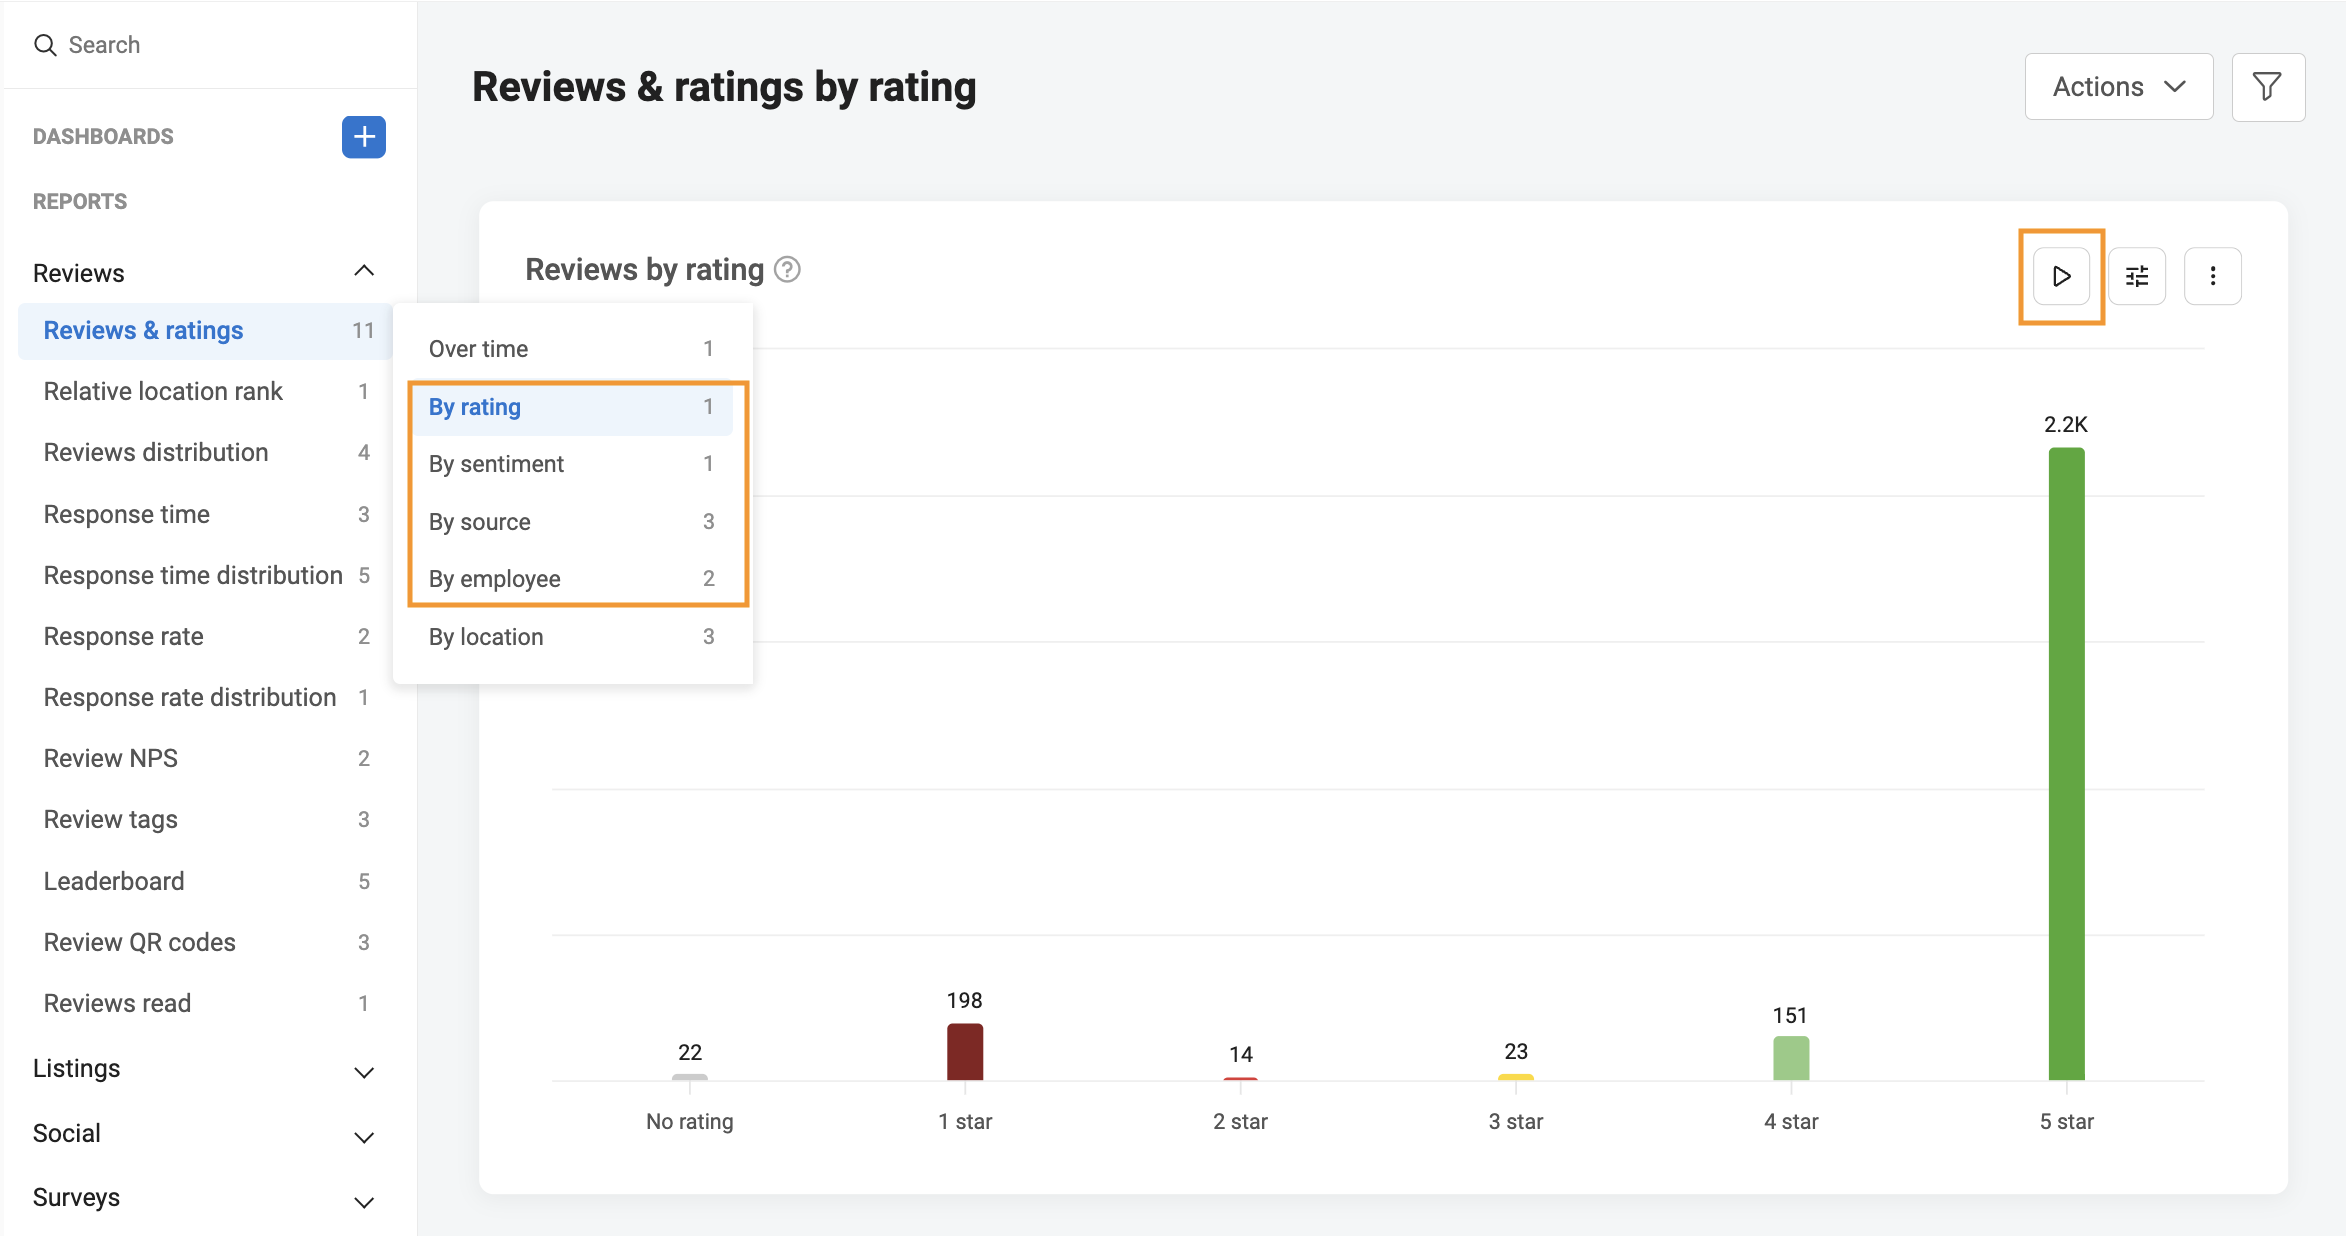
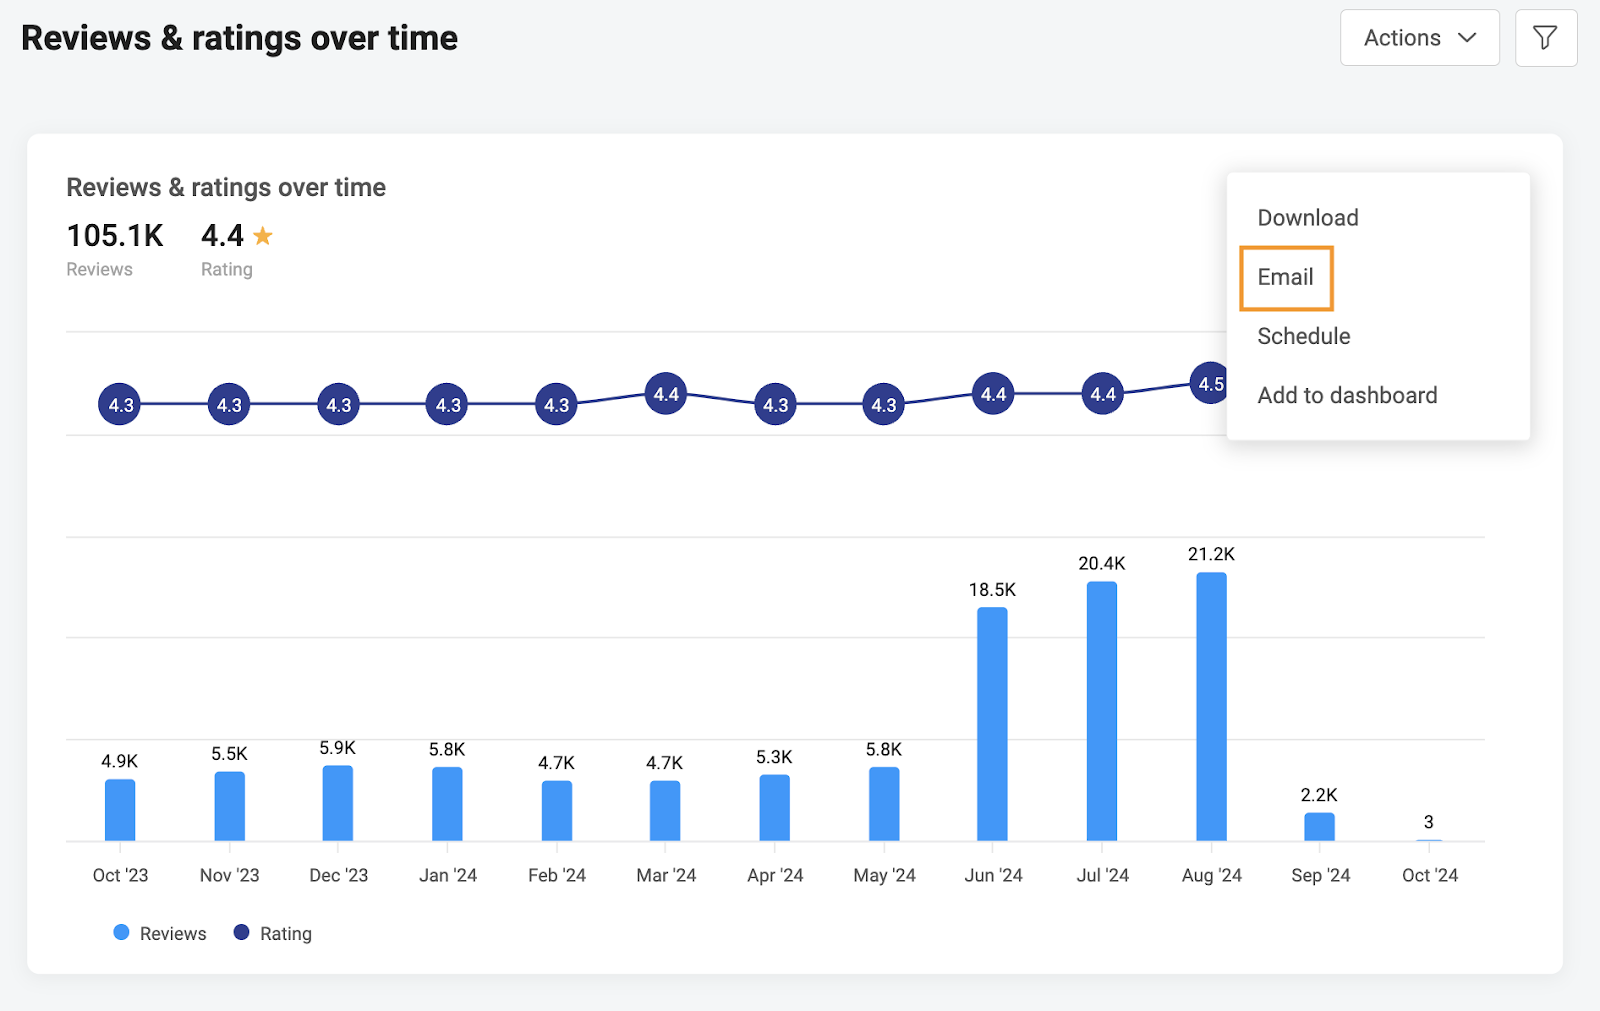
Hover over the 'Reviews and ratings' section to view the 'Reviews & ratings' report sorted 'Over time, By rating, By sentiment, By source, By employee, and By location.'
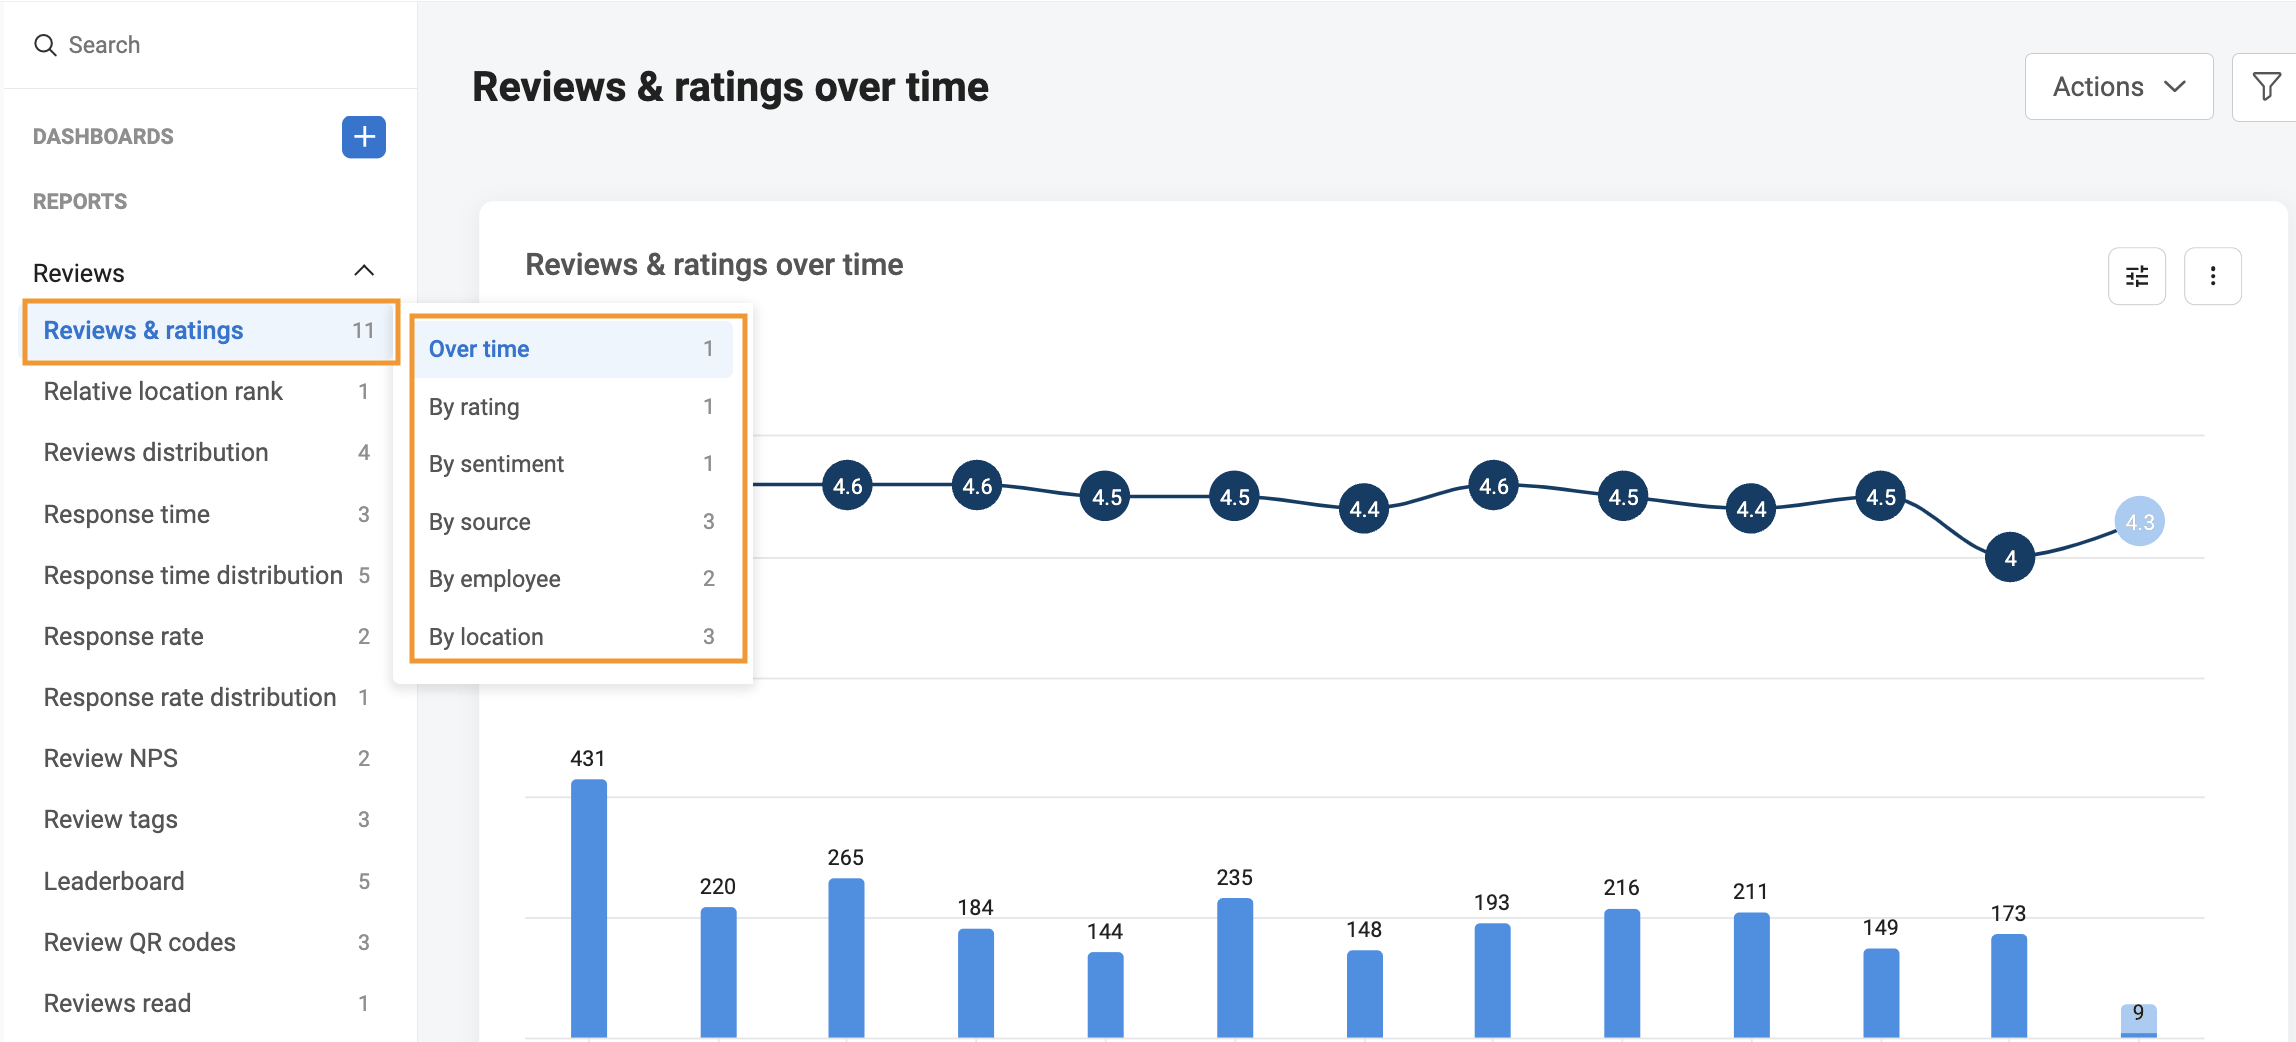
The 'Over time' report helps businesses analyze the total number of reviews with their average rating for a defined period.
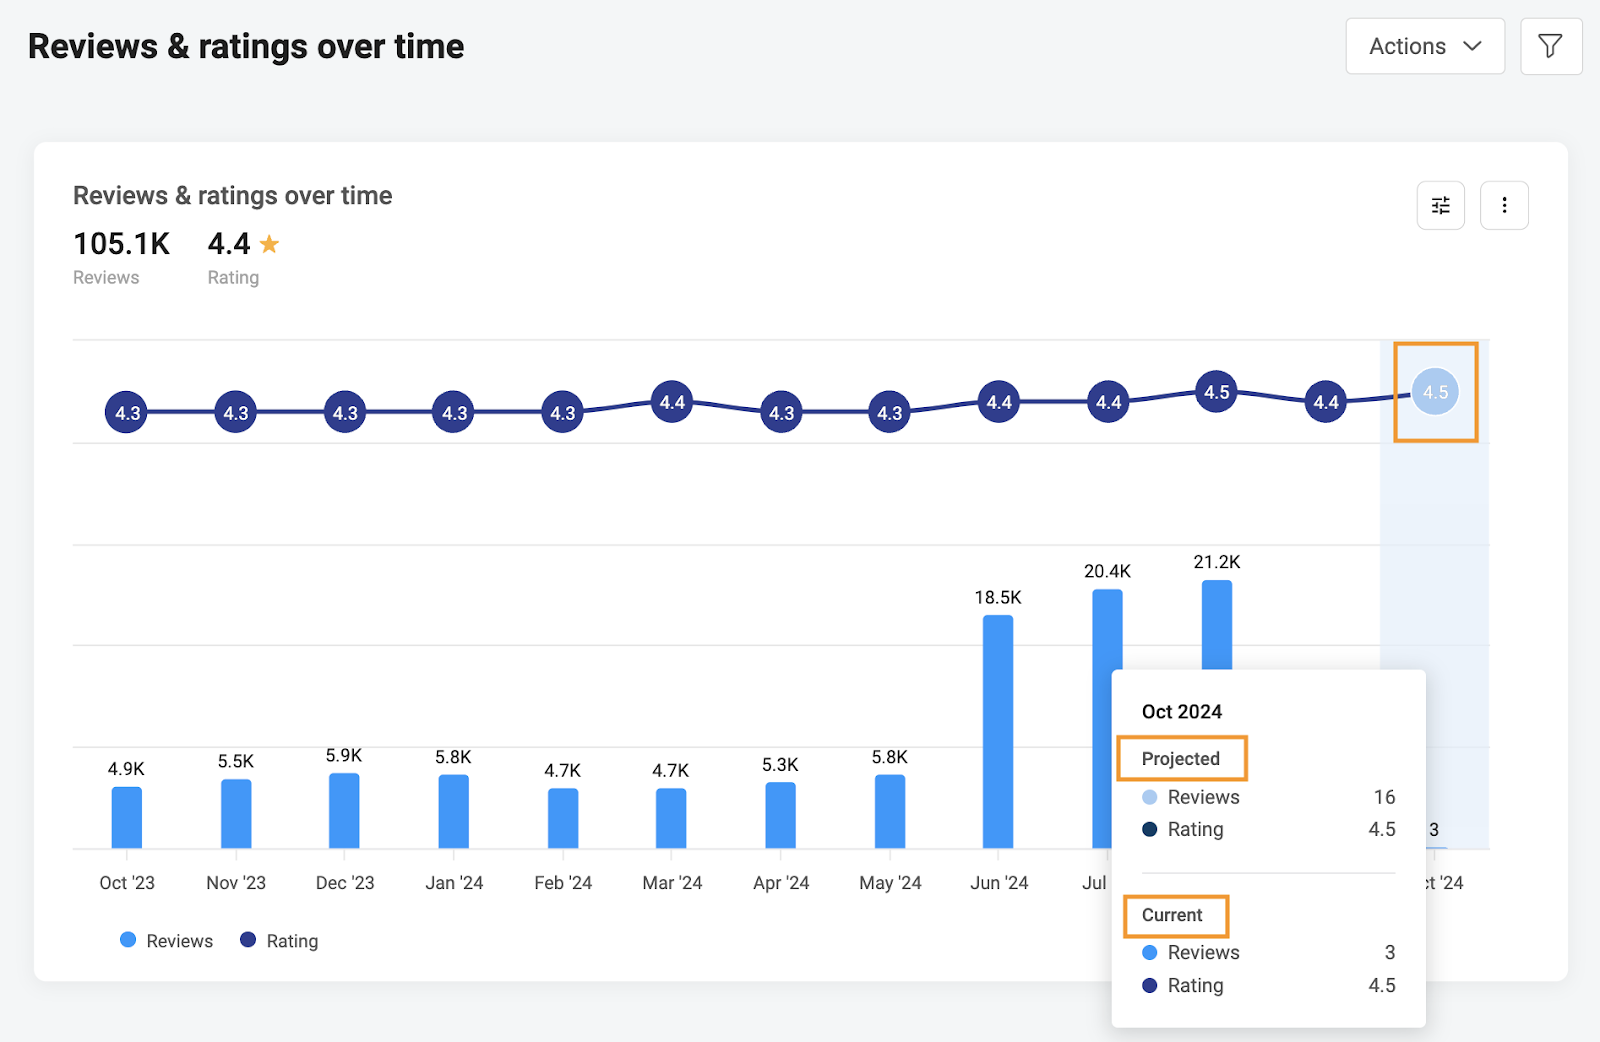
To get detailed data for any period, hover over any bar on the graph.

This feature also provides projected reviews and ratings for the remaining days of the current month, offering an estimate for the full month and the current number of reviews and ratings.
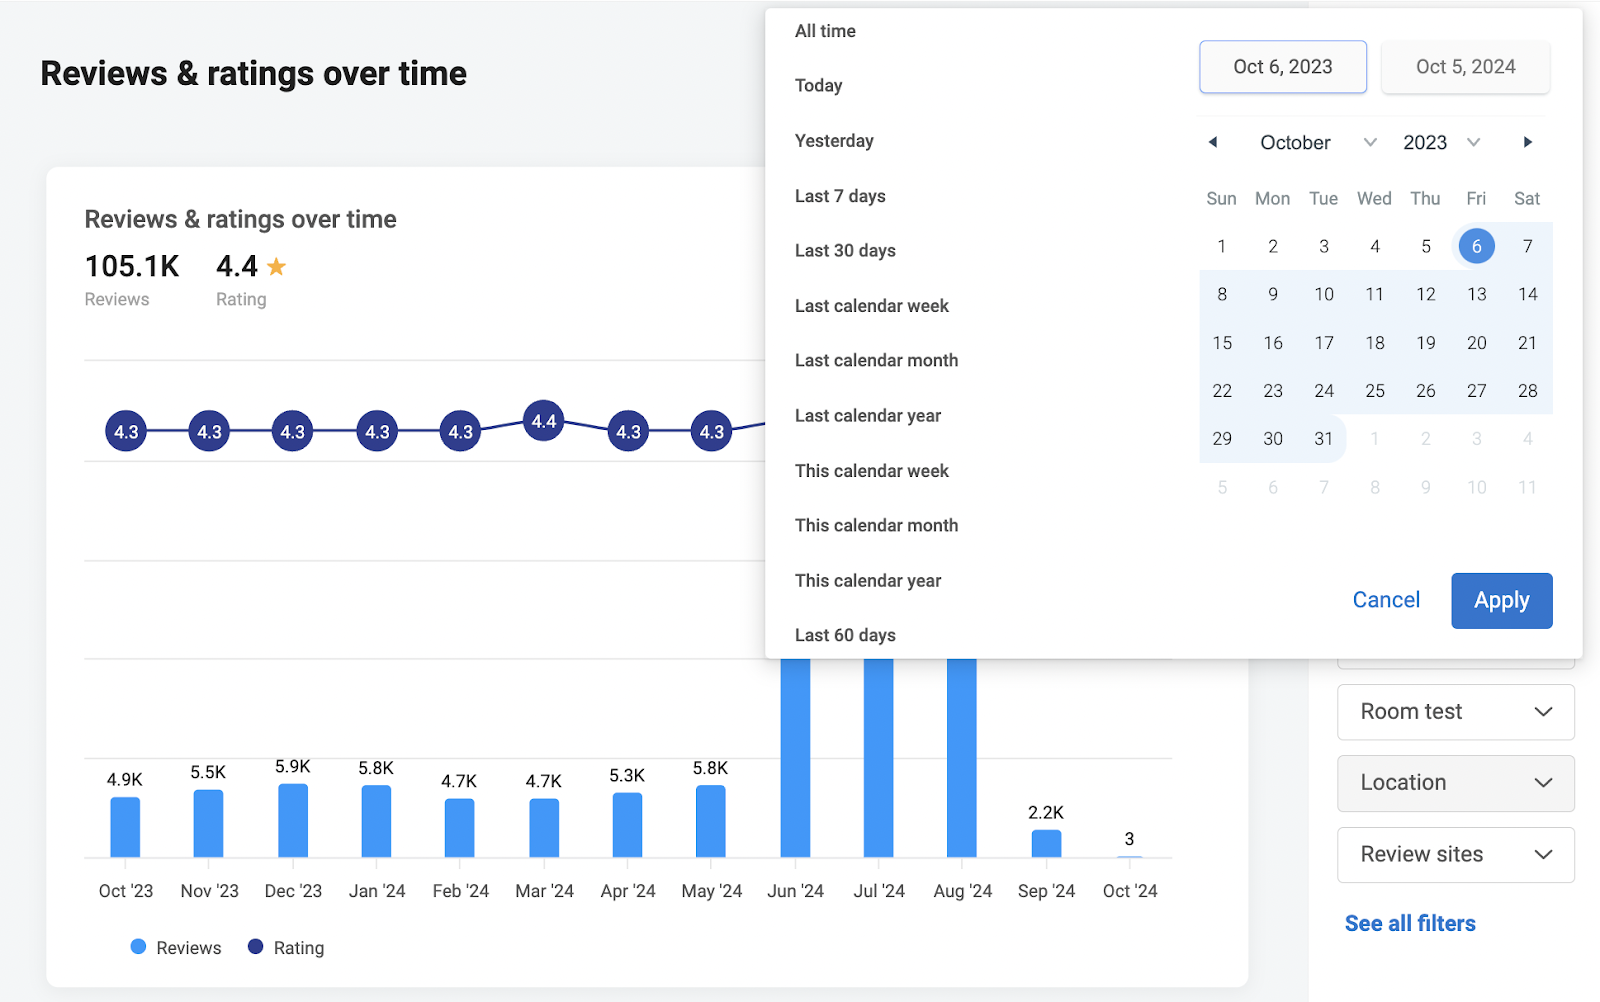
Head to the filter icon and click the time stamp.
View the data on a 'Yearly',' Quarterly', 'Monthly', 'Weekly', and 'Daily' basis, last 60 days or you can select the custom dates. However, the minimum threshold to show projected data is more than a day. Click on the 'Monthly' drop-down menu to change the time format.
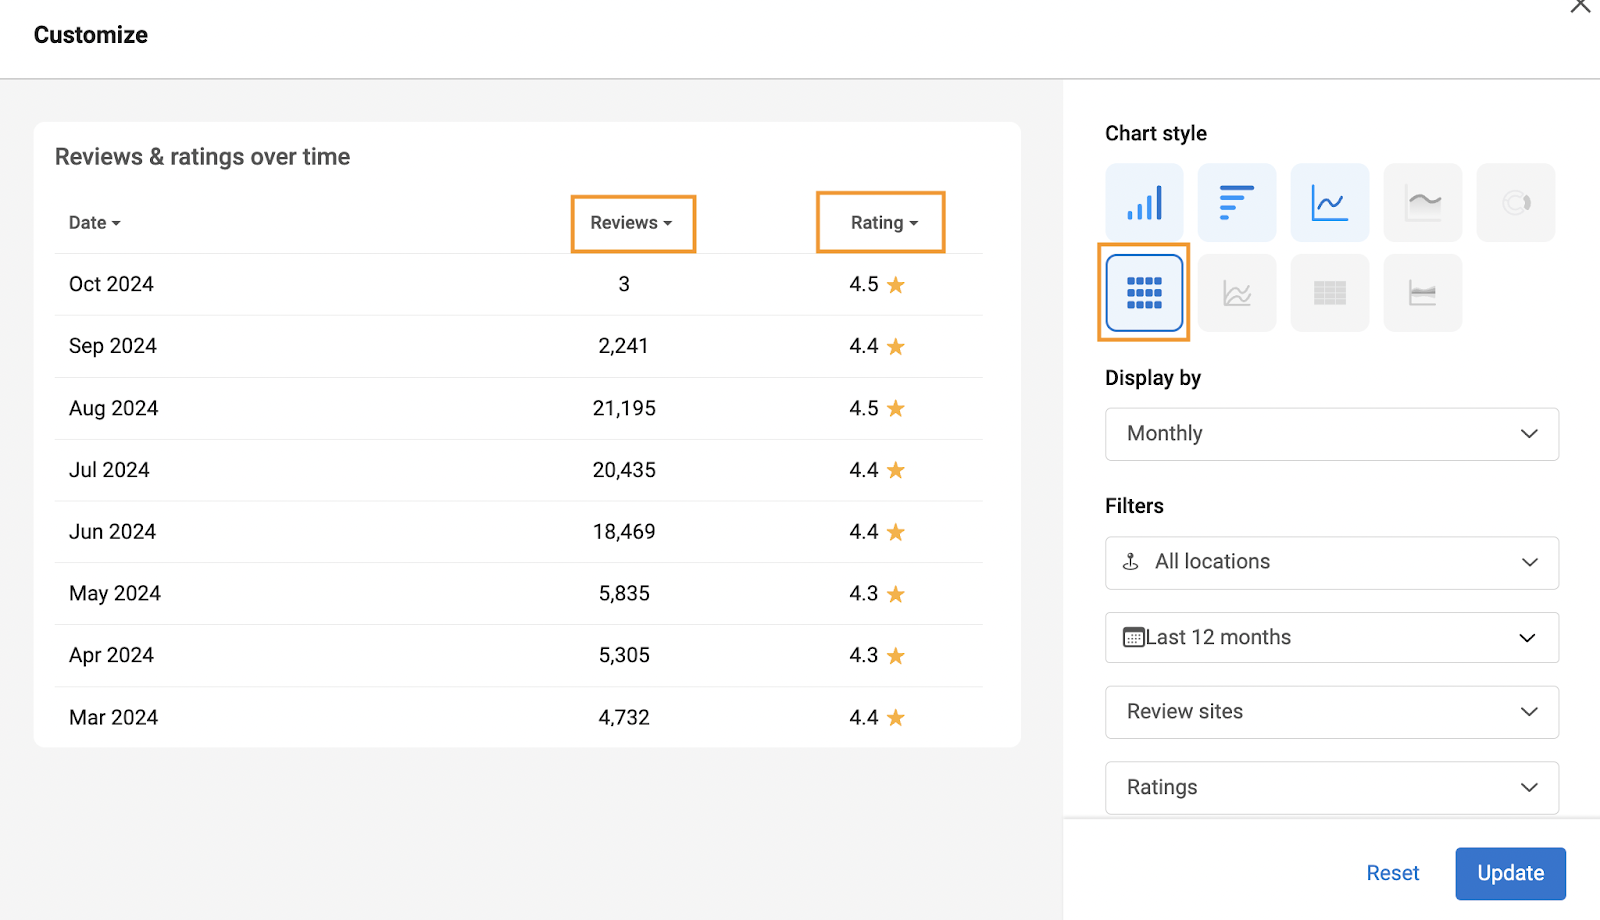
Click the ‘Customize’ icon.
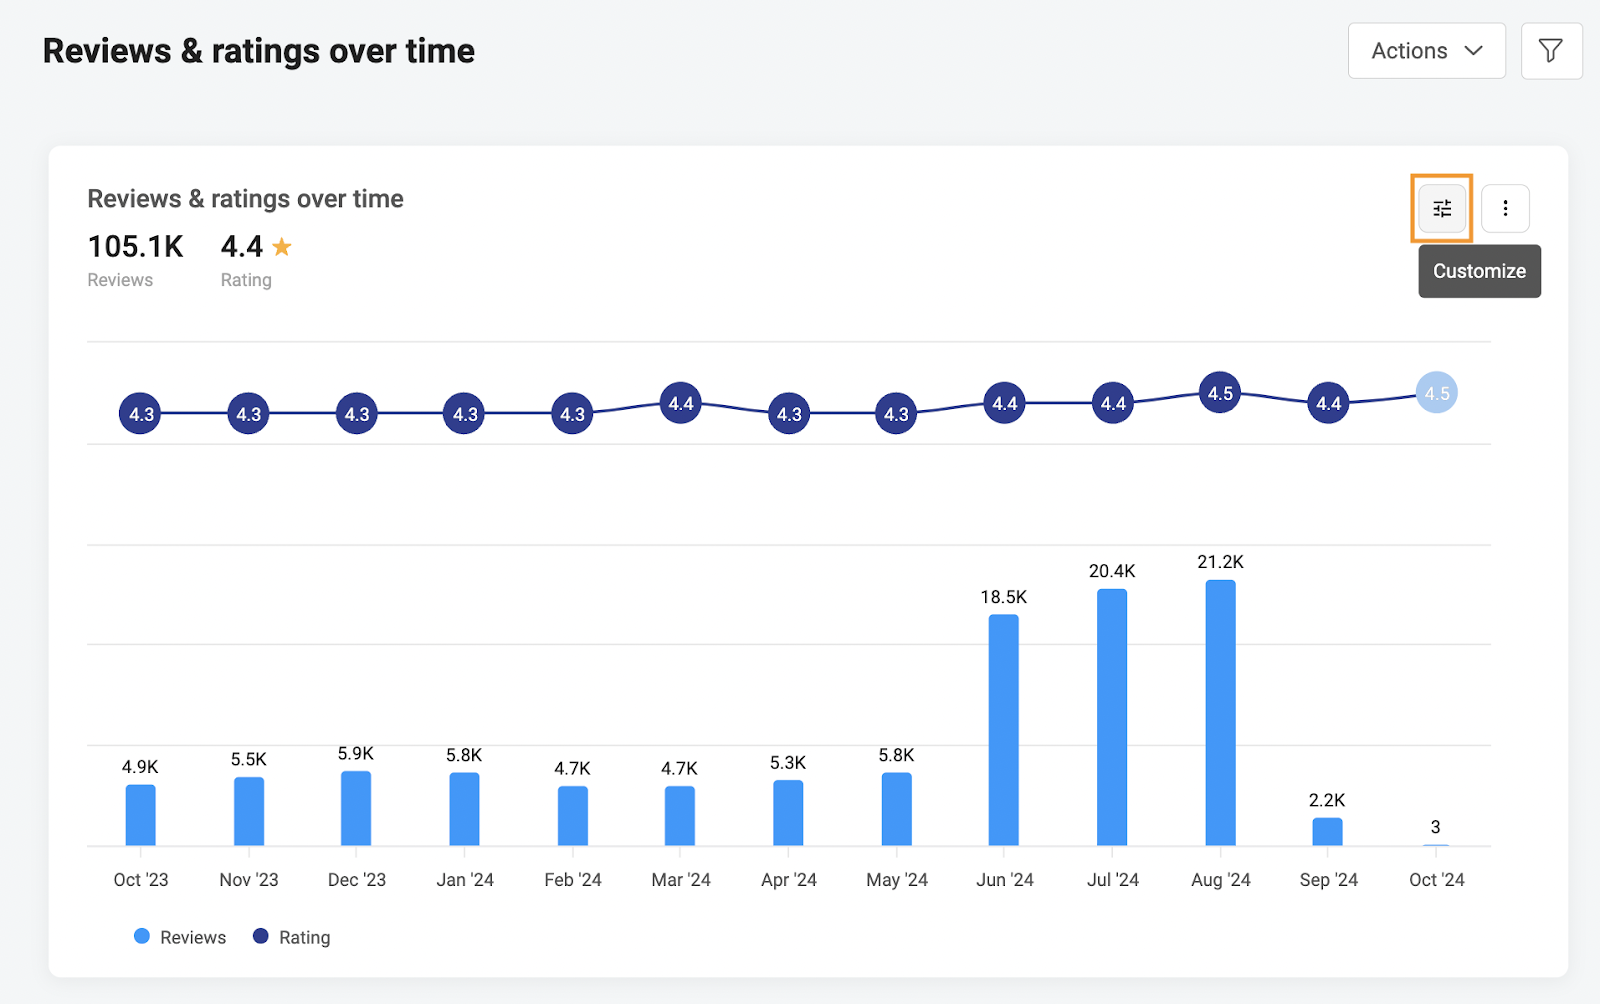
View the 'Over time' report in various types of line and bar charts and the 'Table' format. You also have filter options based on time, location, review sites, and ratings. Click ‘Update’ after customizing the report.
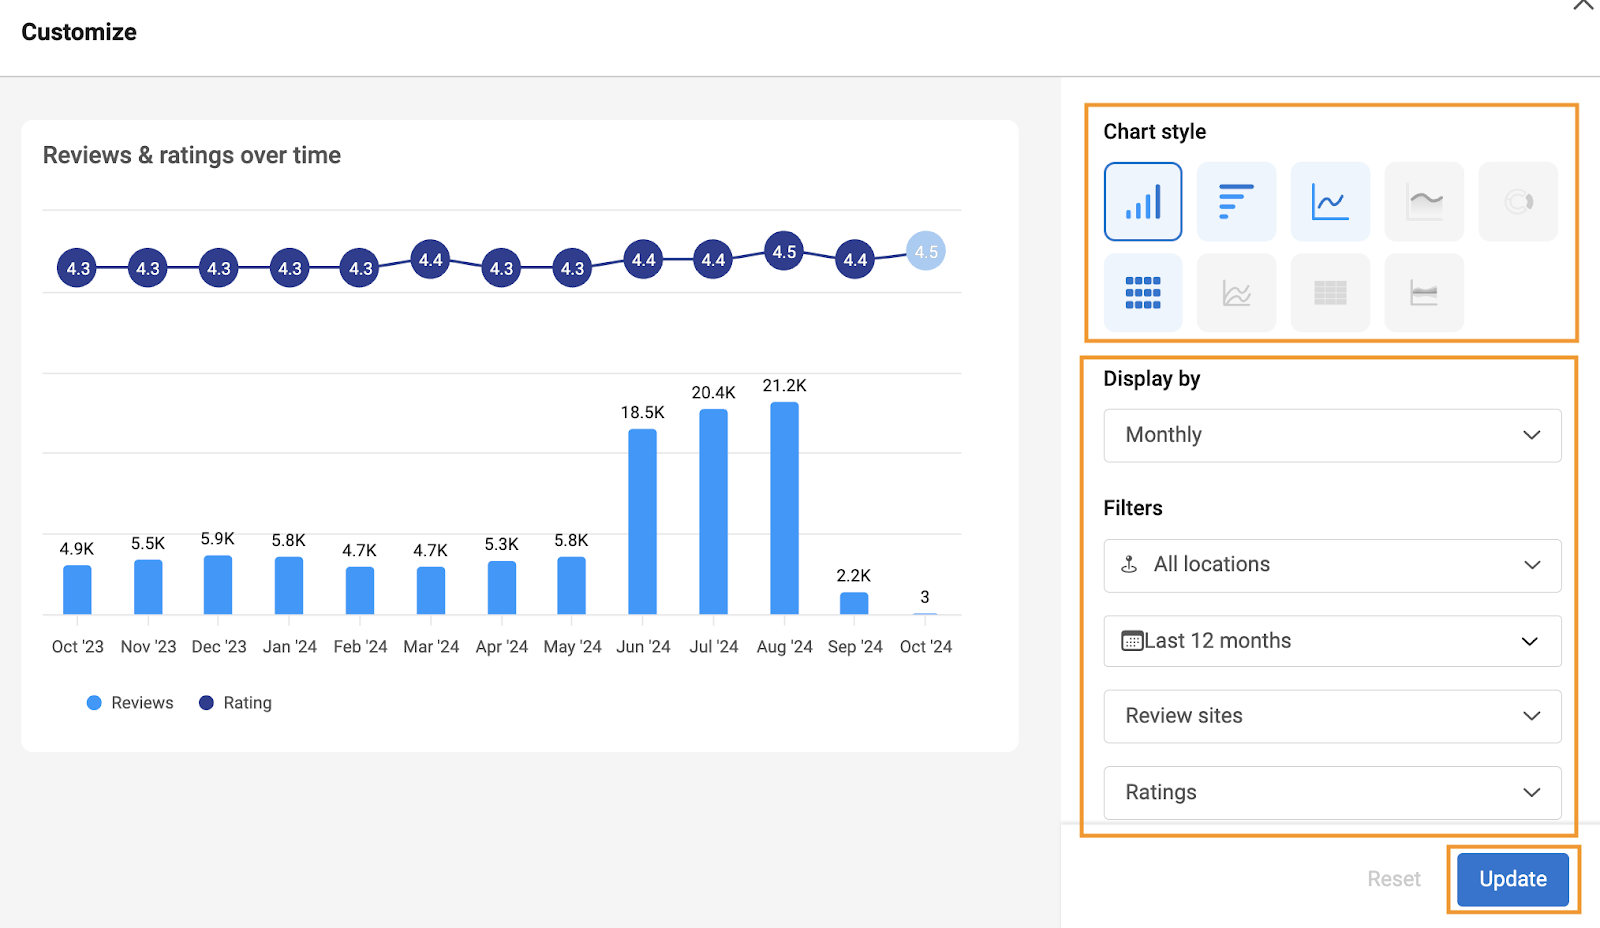
You will be able to see the 'Reviews count' and the 'Average rating' in the 'Table' format.
You can also view the 'Reviews and ratings' report in an animated visualization to view how a particular report changes with time. Hover over 'Reviews and ratings,' go to any of these reports: By rating, By sentiment, By source, or By employee, and click the 'Play' button on the top right corner to view these reports in the form of an animation.
Cumulative Reports
Users can view cumulative reviews and ratings in the over time reports. When the cumulative view is enabled, the data for February will include reviews and ratings from January and February, continuing to accumulate each month.
Select ‘View aggregated data’ in the ‘Customize’ tab, and click ‘Update.’

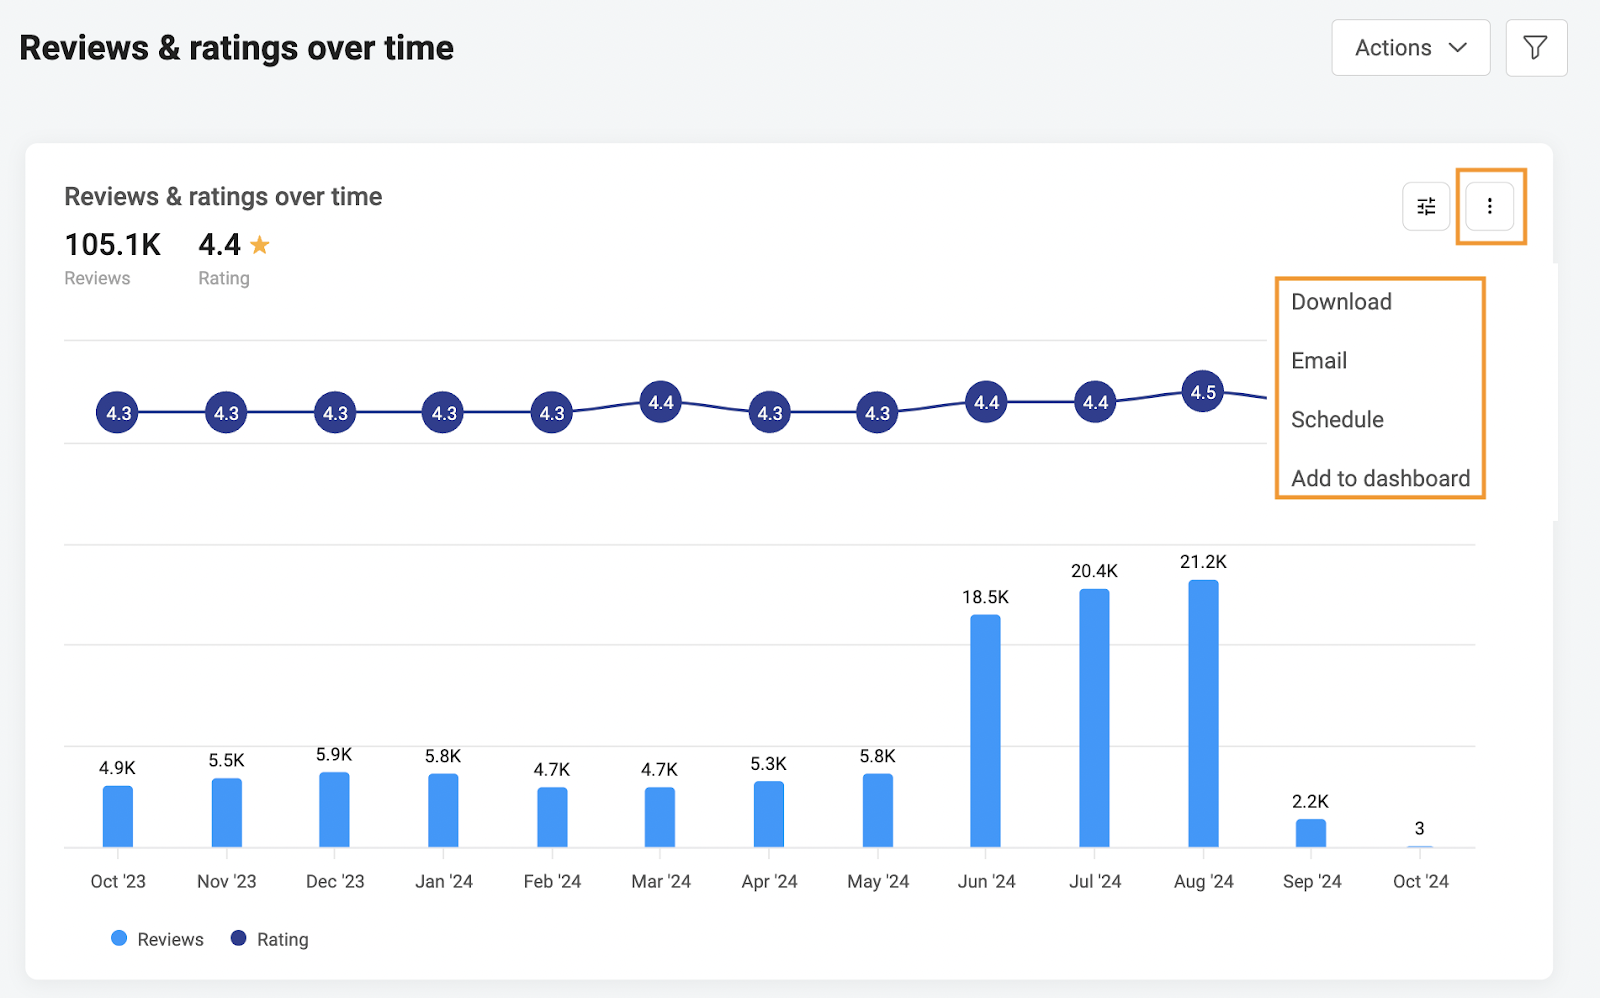
Schedule, Email, and Download Reports
Birdeye users can email, download, schedule, and add review reports to the dashboard. Click the three vertical dots to view the options.
To learn more about ‘Dashboard,’ refer to the help center article - A comprehensive guide to Birdeye Dashboards.
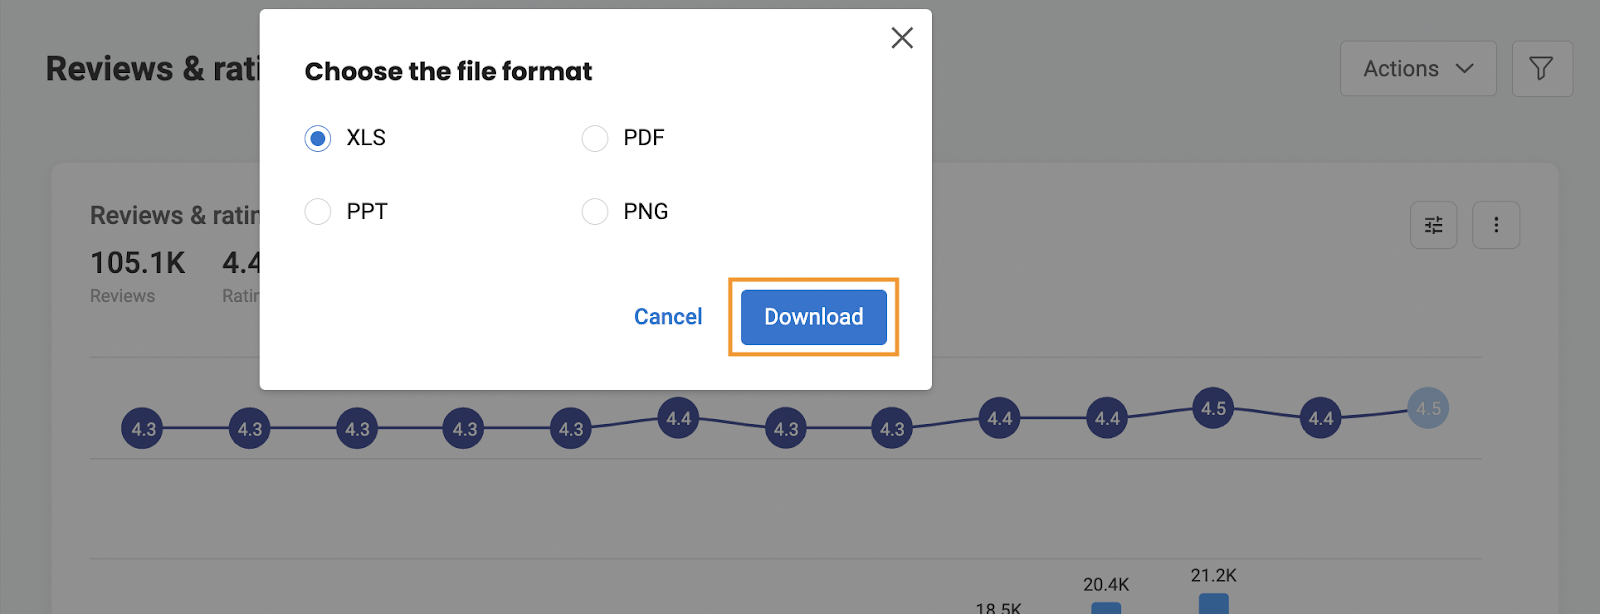
Download Review Reports
The review reports can be downloaded by selecting the 'Download' option. A pop-up window appears, select whether you want to download the report in XLS (Excel), PDF, PPT, or PNG format. After selecting, click the 'Download' button.
Receive Email Reports
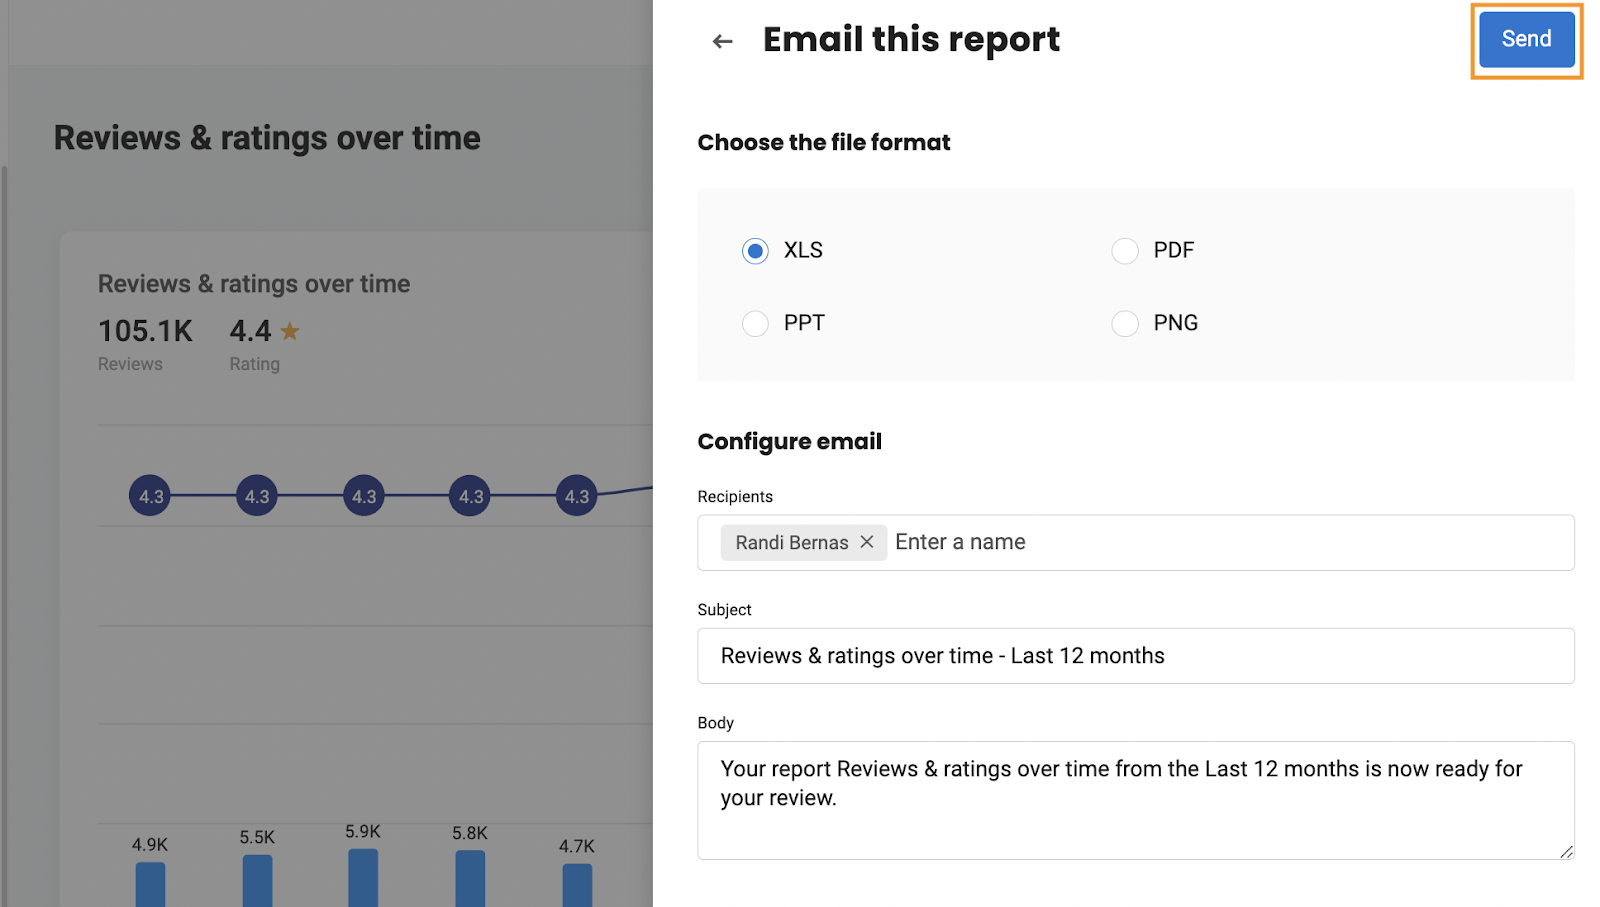
You can send review reports via email.
Click on ‘Email.’
Reports can be sent to users who have been added to the Birdeye dashboard. A drawer opens on the right side. The subject line and body have pre-filled placeholder text but are also customizable. After filling in the required information, click ‘Send’ in the top right corner.
Schedule Review Reports
You can schedule review reports under the ‘Reports’ tab. You can select different dates and time frequencies to schedule the reports. You can set reports to be delivered on a daily, weekly, monthly, or quarterly basis in the XLS or PDF format. To learn how to schedule the Review reports, refer to the help article: How to download and schedule Review reports.
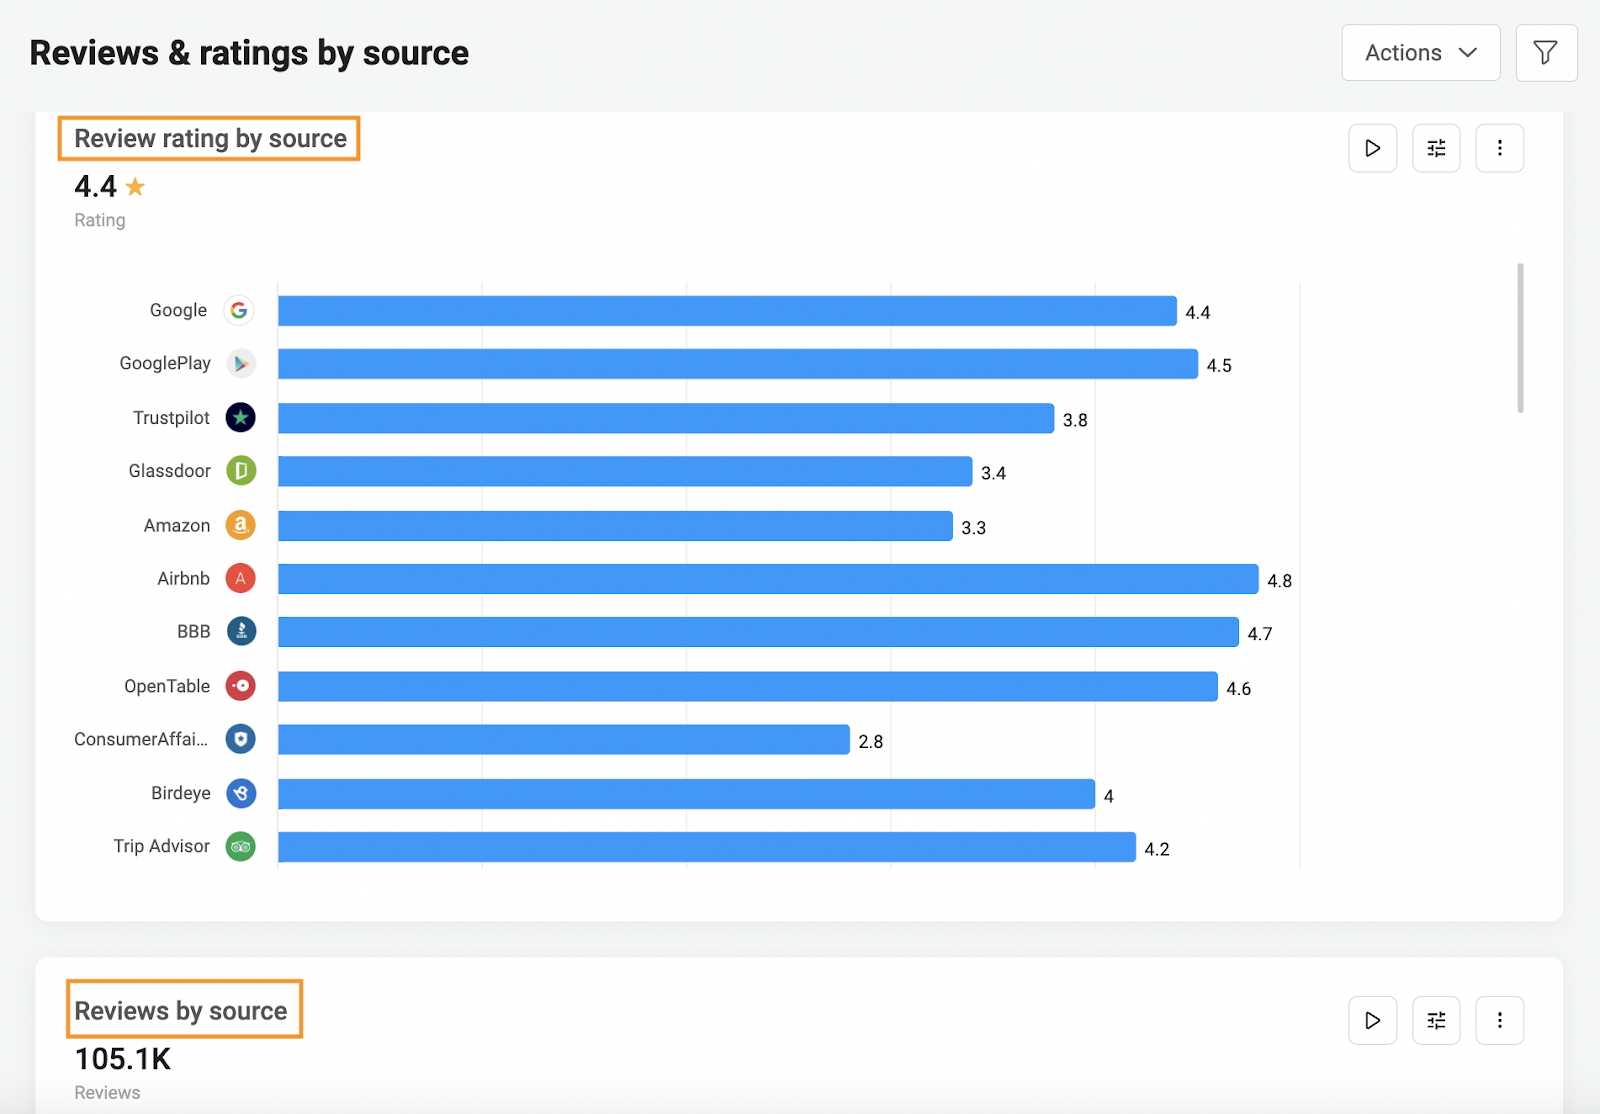
The 'By source' review report displays the average number of reviews and ratings received from the different review sources.
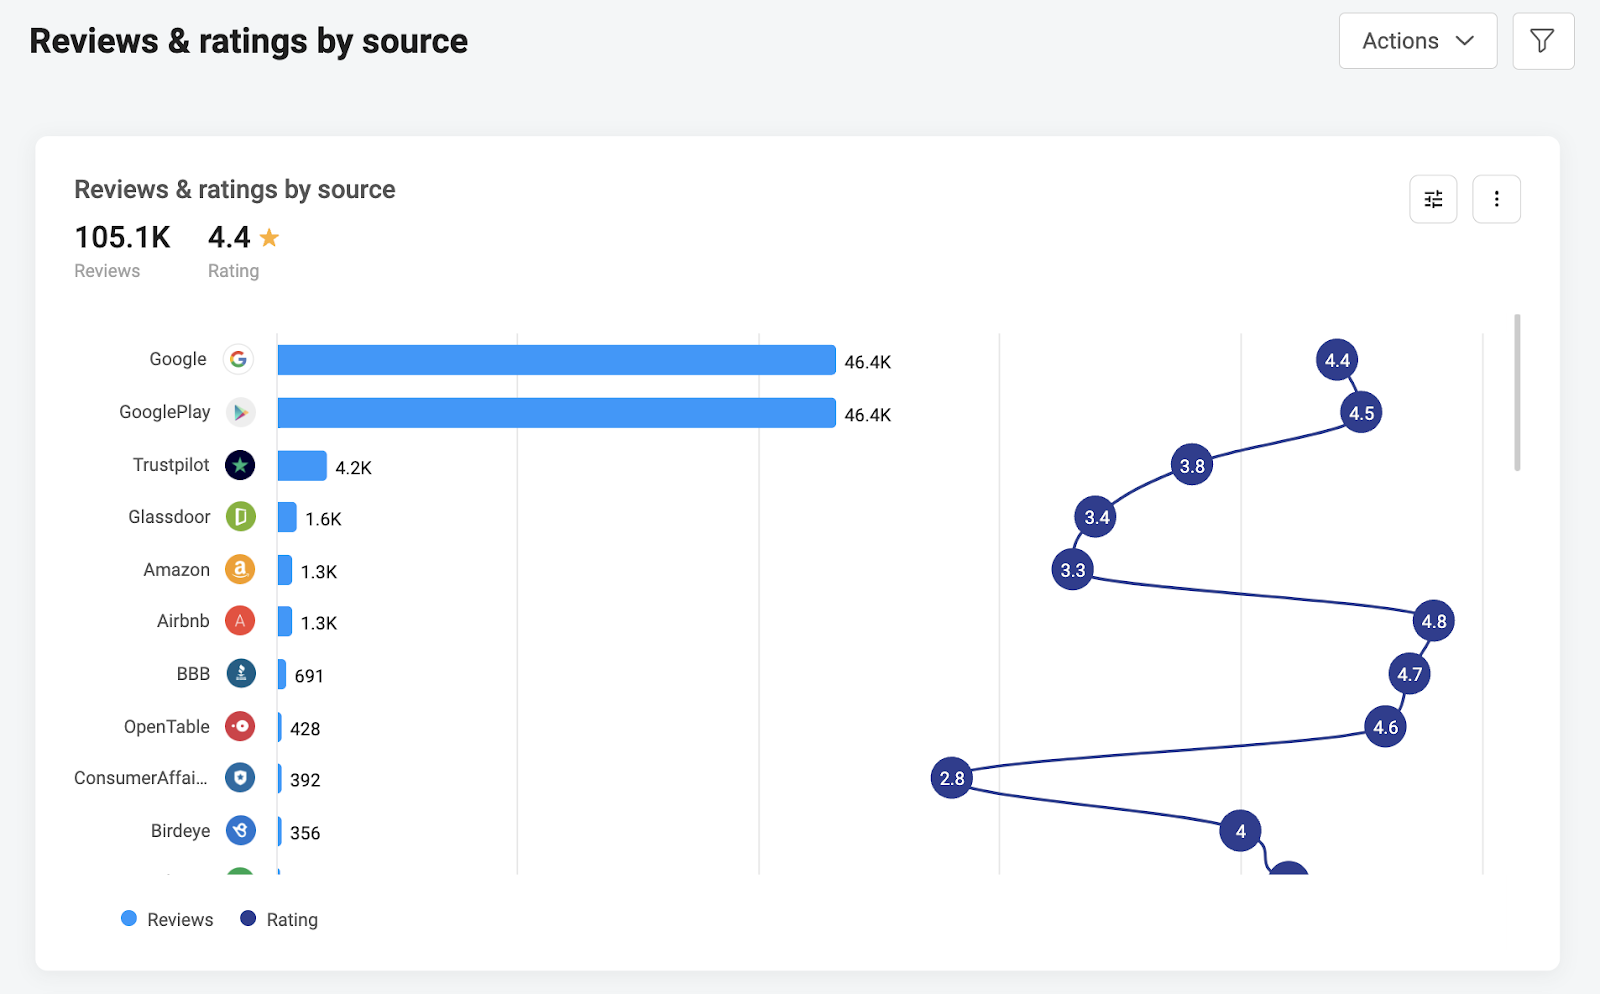
Scroll down to view reviews and ratings by source, displayed individually.
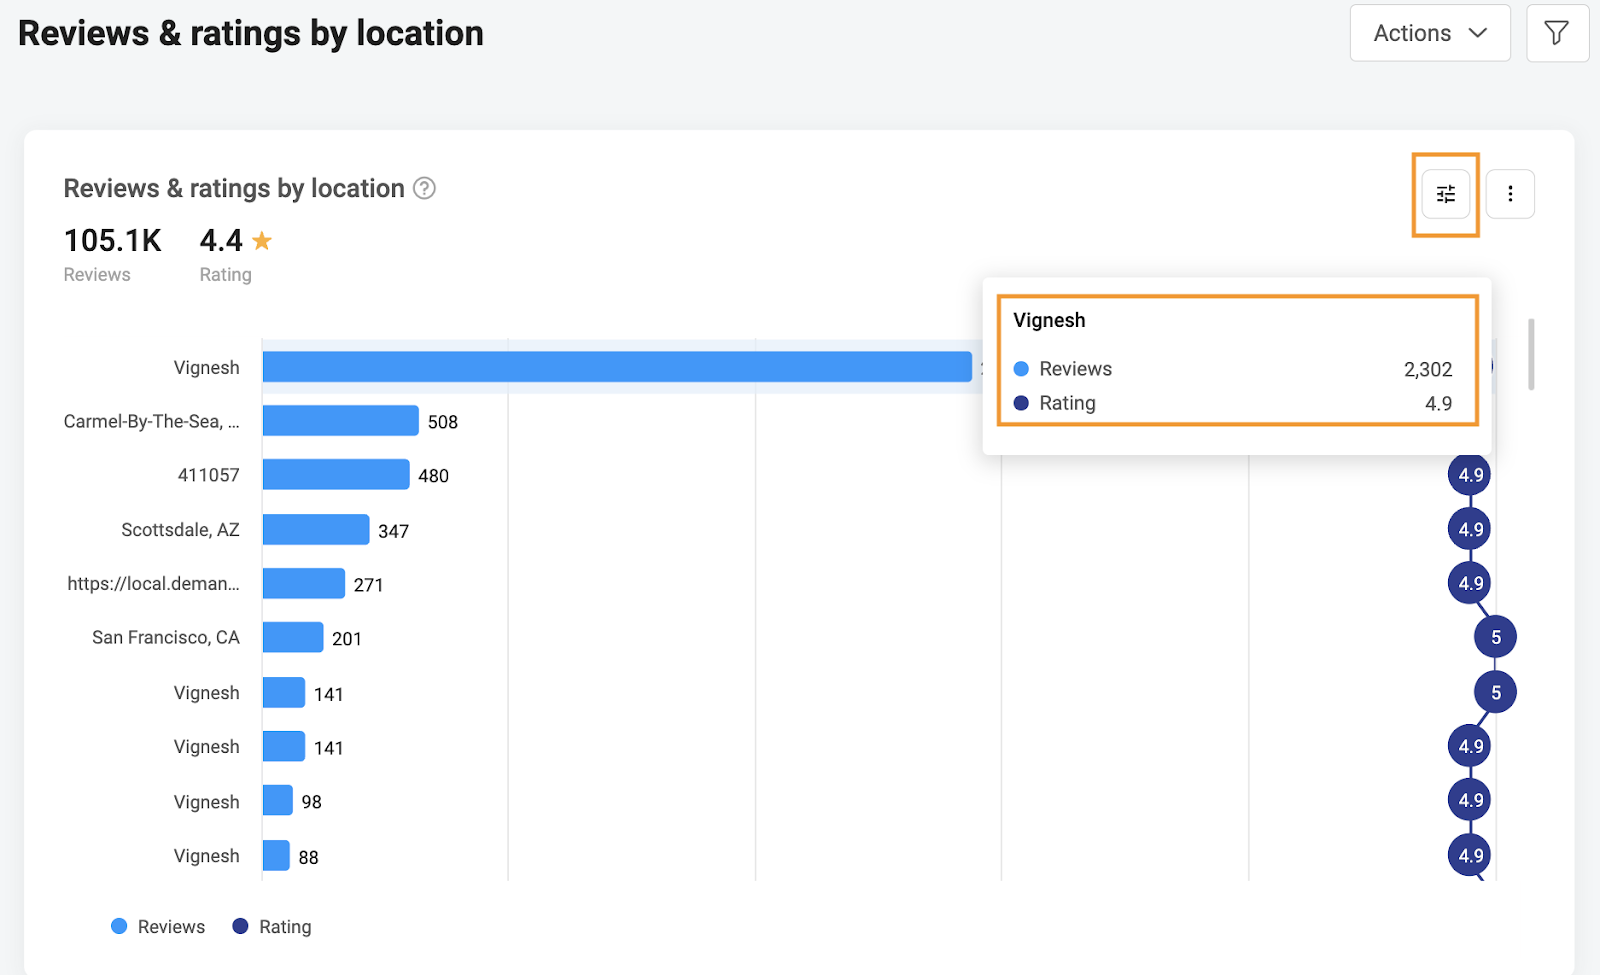
'By location' reports track the reviews and ratings for all locations. This report is customizable to view in different bar charts and table formats. Hovering over the bar indicating the location will give you the average review rating with the total reviews for that location.
NOTE:
'By location' reports are available for enterprise customers only.
The 'Leaderboard' report summarizes the performance of employees under the categories of reviews requested, reviews received and ratings. To learn more about reading the 'Leaderboard' report, read this help center article: Where can I view the performance of all my employees within the Birdeye dashboard - Employee Leaderboard?
To learn more about 'Visitor' reports, click here.
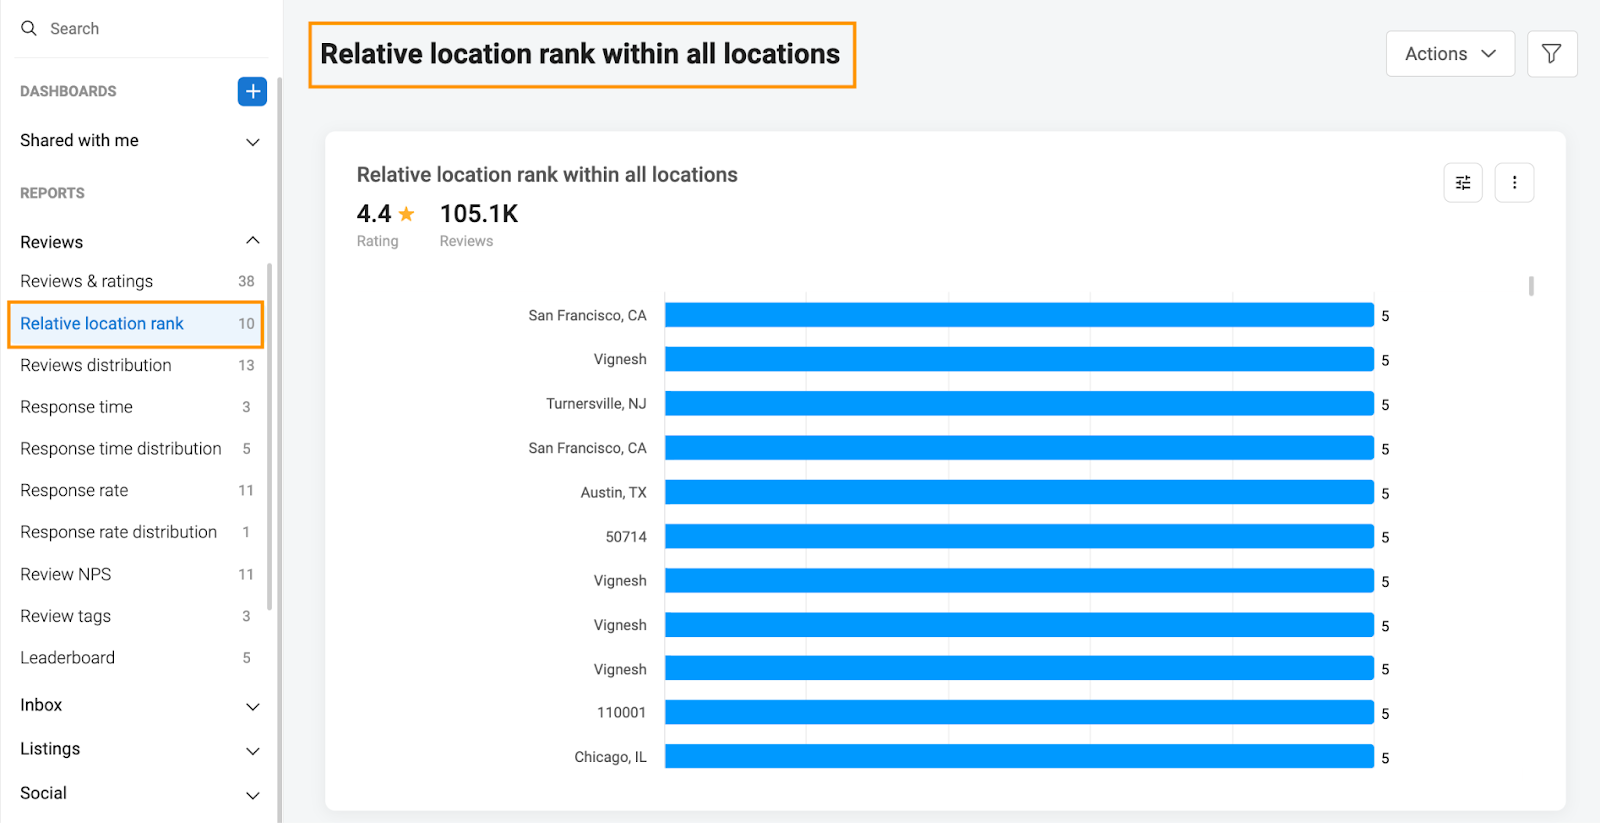
Relative Location Rank
The report on 'Relative location rank' within all locations helps businesses understand how different locations stack up against each other. This report is available only to enterprise customers.
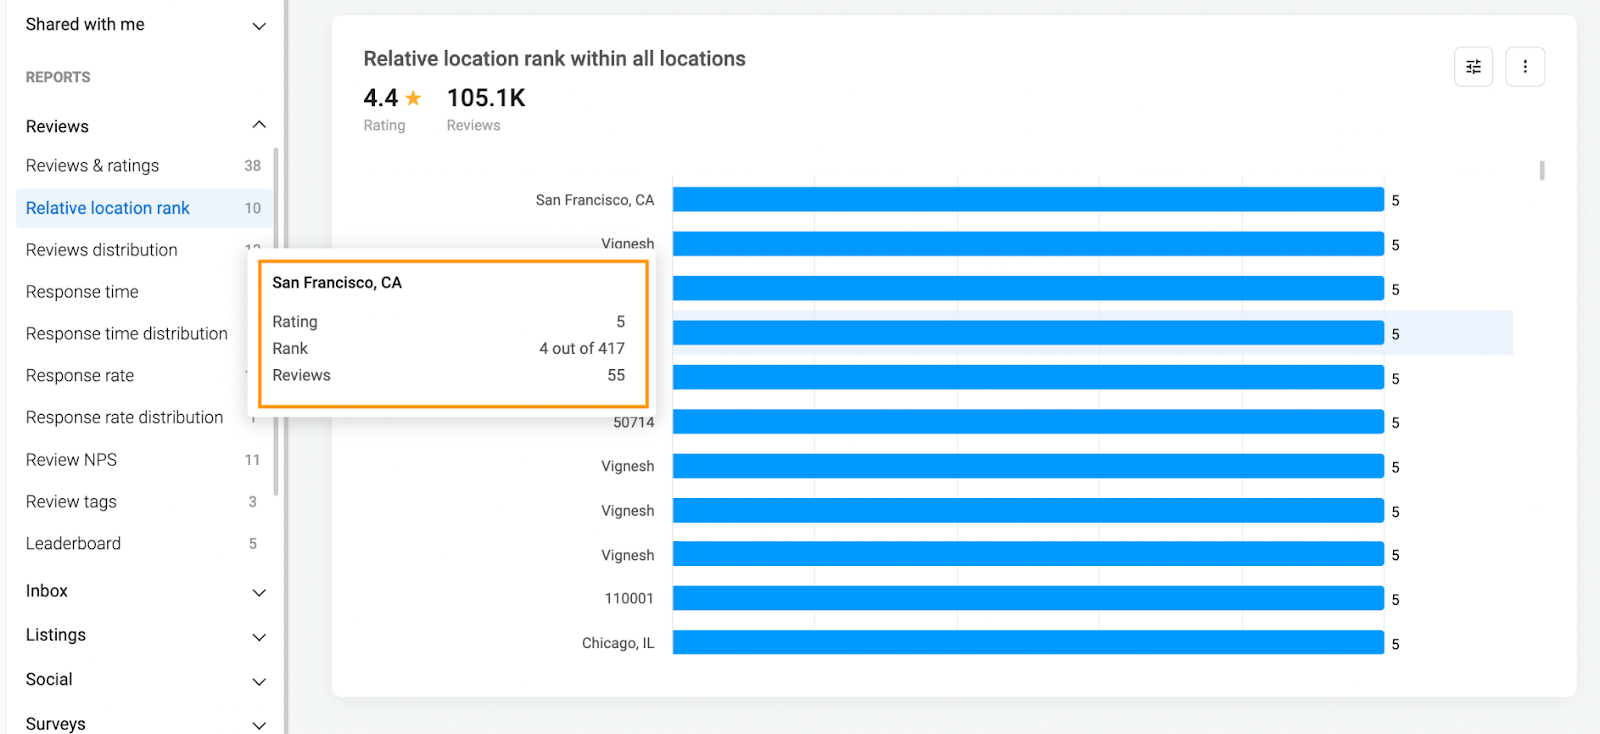
Hover over the bar to view the location’s ‘Rating, rank, and reviews received.’
Average Response Time
The 'Average response time' reports are sorted by 'Over time, Employee, and Location.'
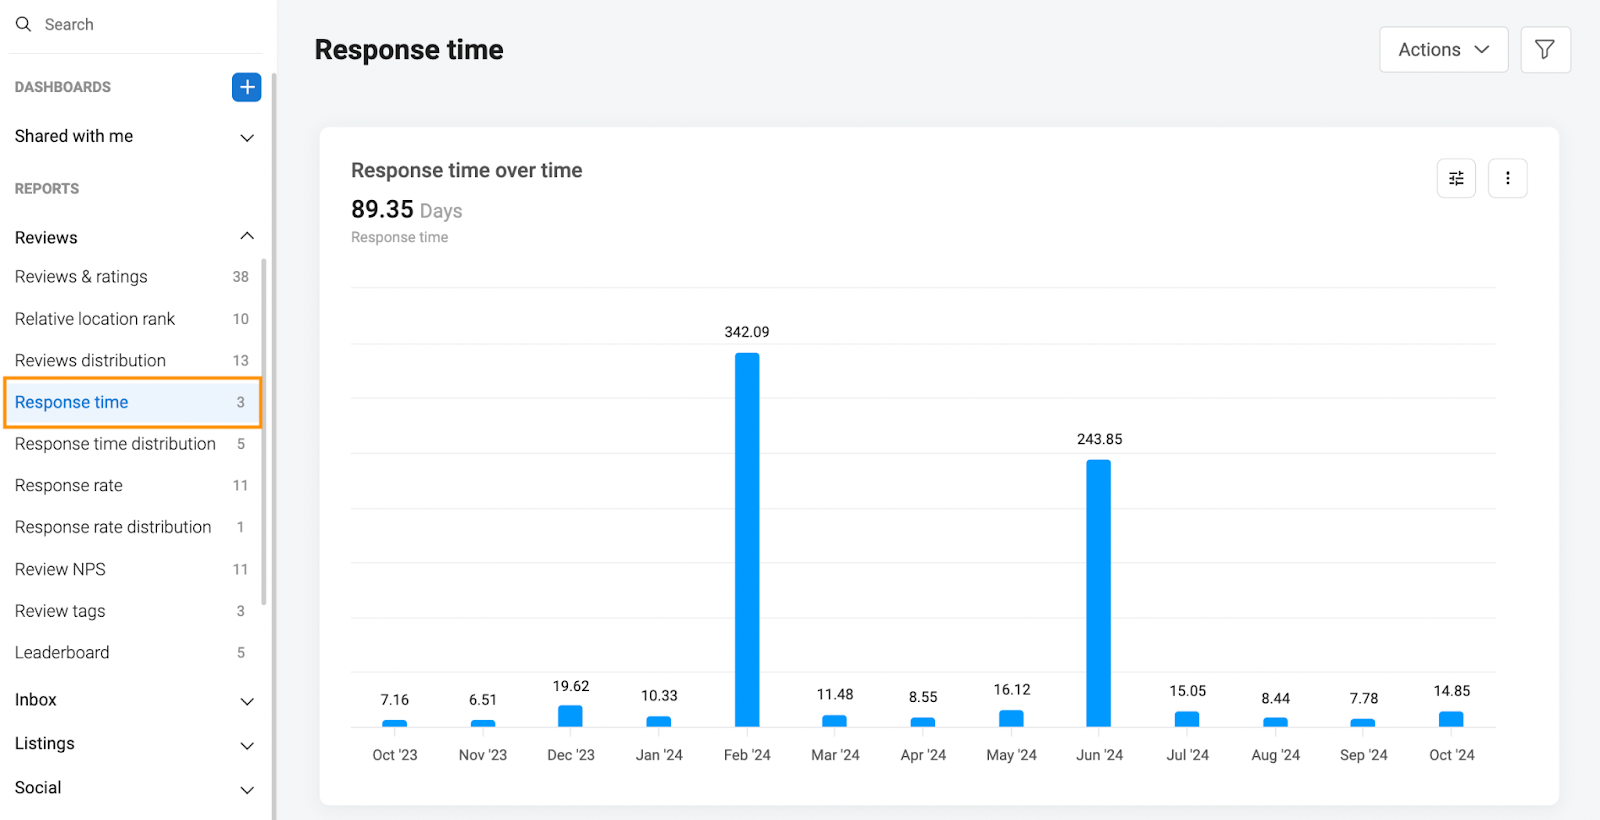
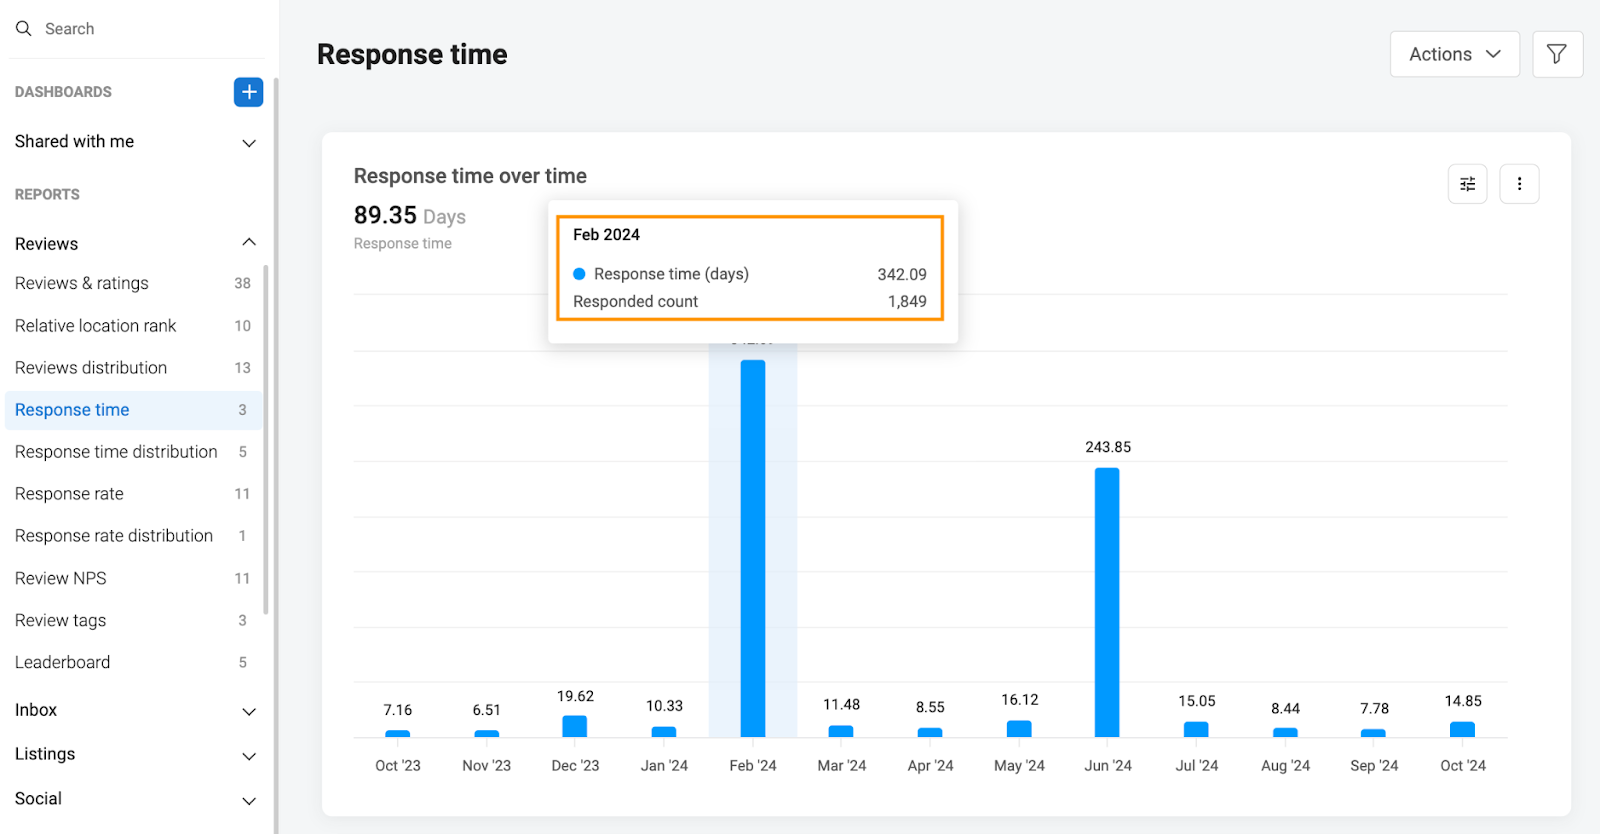
The 'Over time' report helps businesses analyze the average response time for a defined period. To read the detailed data, hover over any bar on the screen.
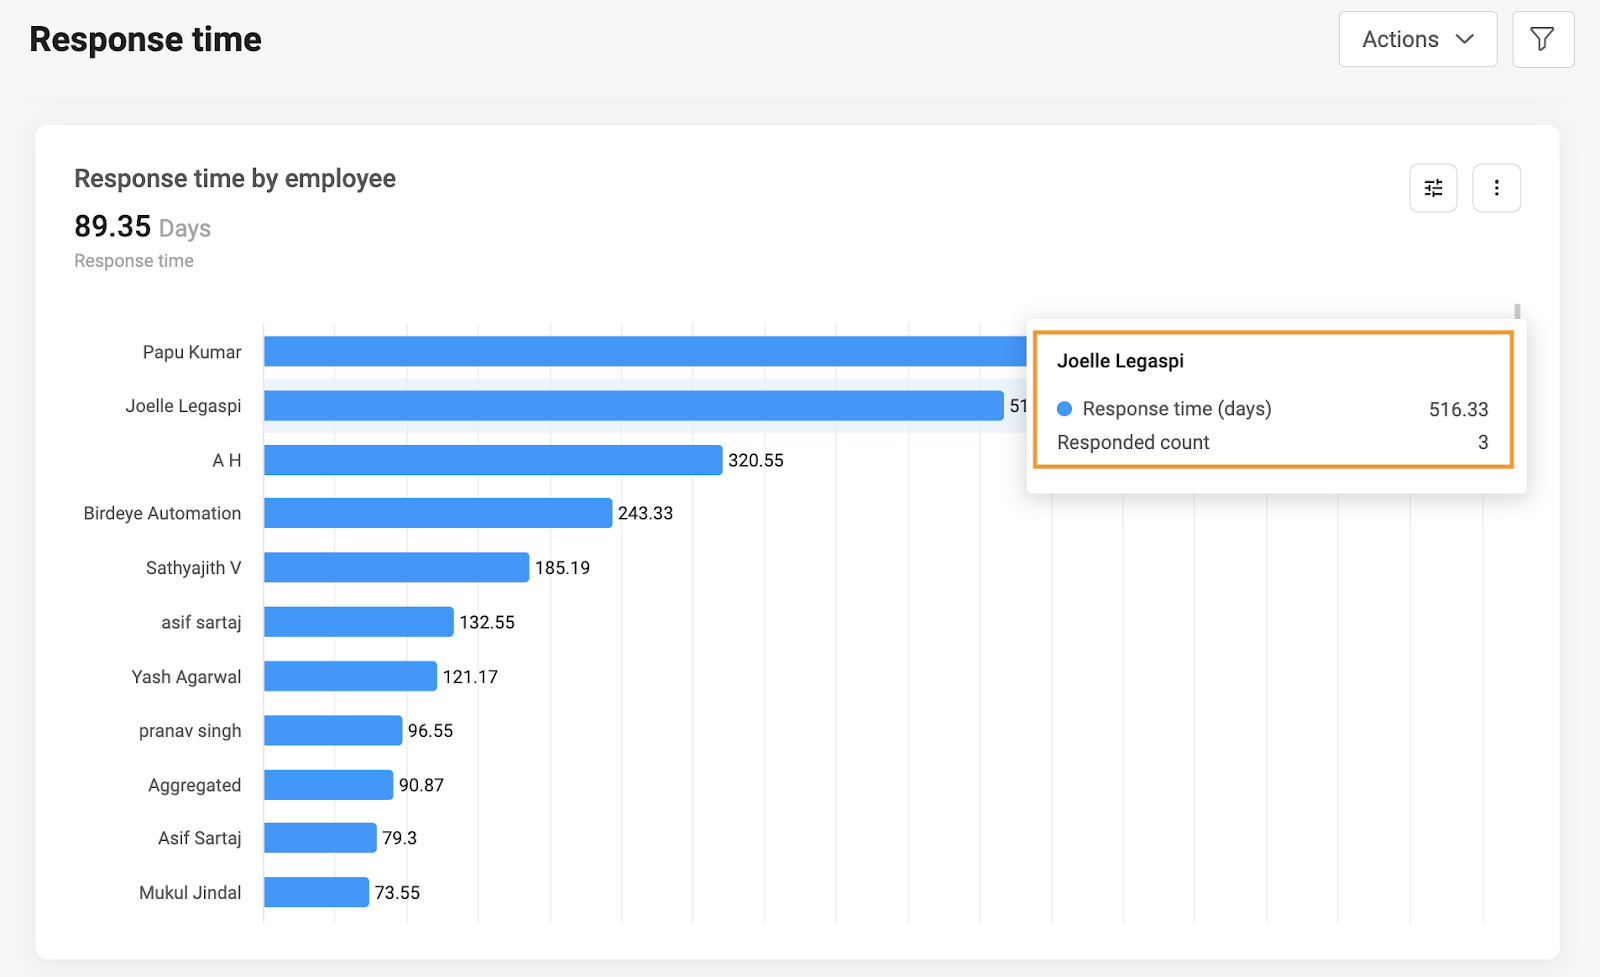
The ‘Response time by employee’ displays the time each employee takes to respond to reviews, along with the number of responses they have completed.
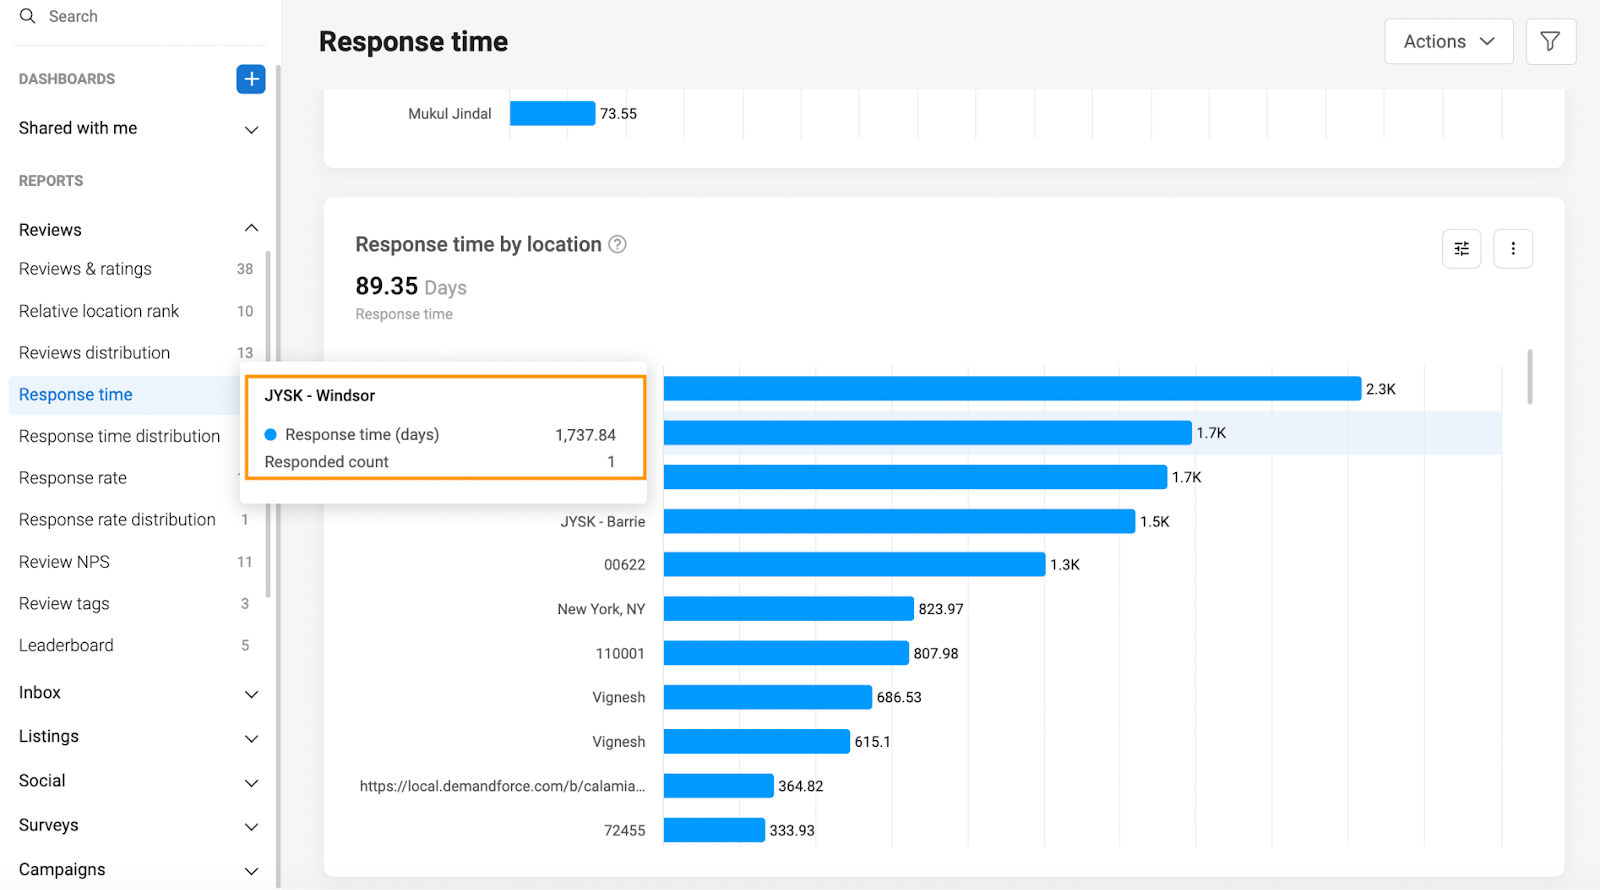
The ‘Response time by location' report displays the average response time for all the business locations. Hover over the bar to view the report for one location.
NPS Reports
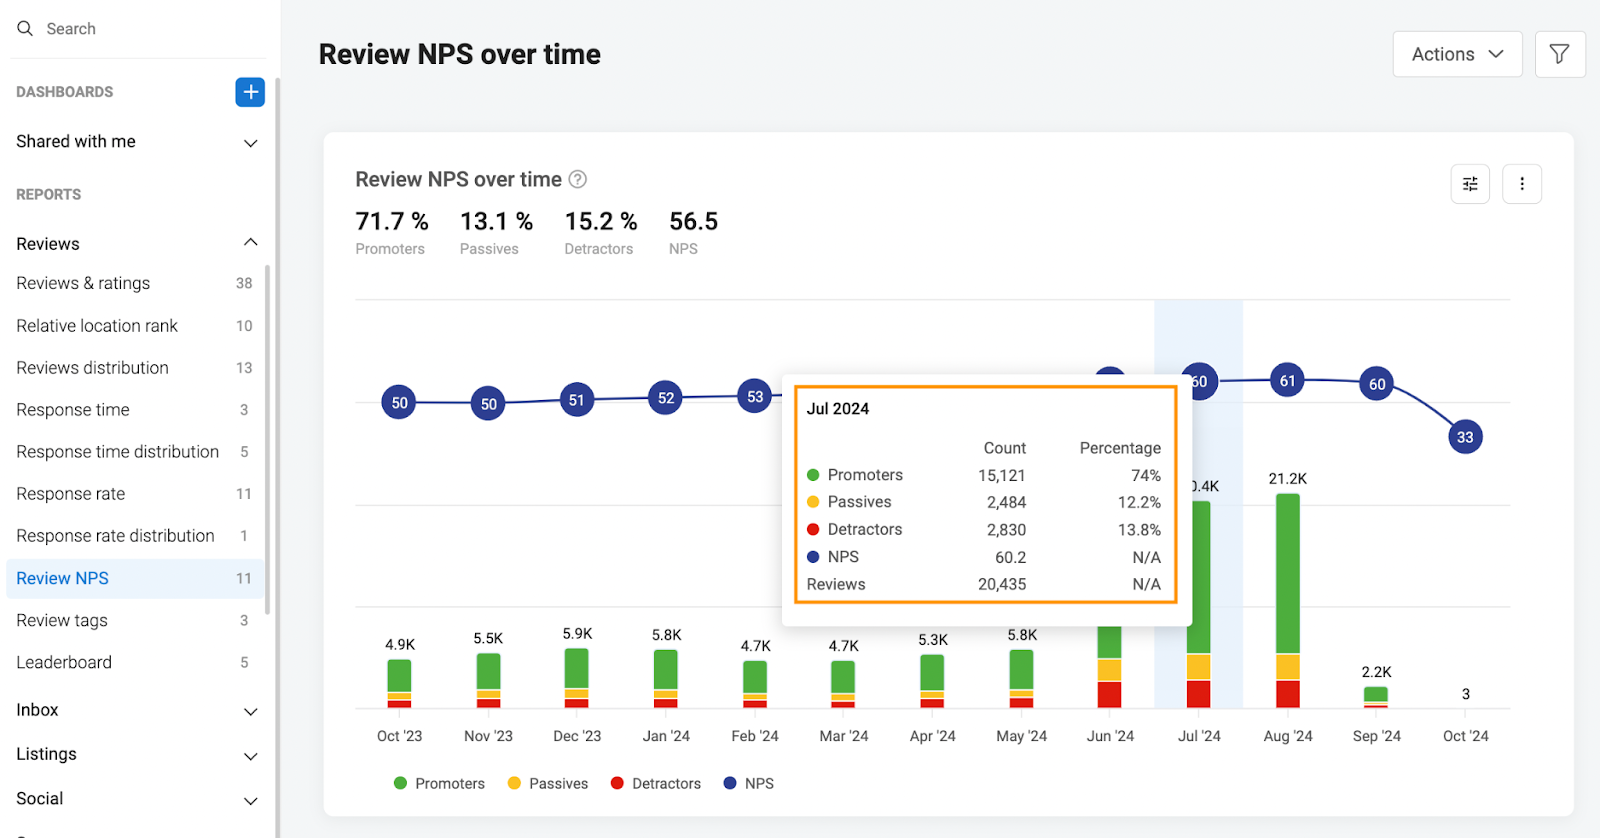
The 'Over time' NPS report helps businesses analyze the review of customer sentiment for a defined period. The data will be visible in terms of 'Promoters, Detractors, Passives, and NPS.’ Hover over any bar to view the count and percentage data for 'Promoters, Passives, Detractors, and NPS’ over a period of time.
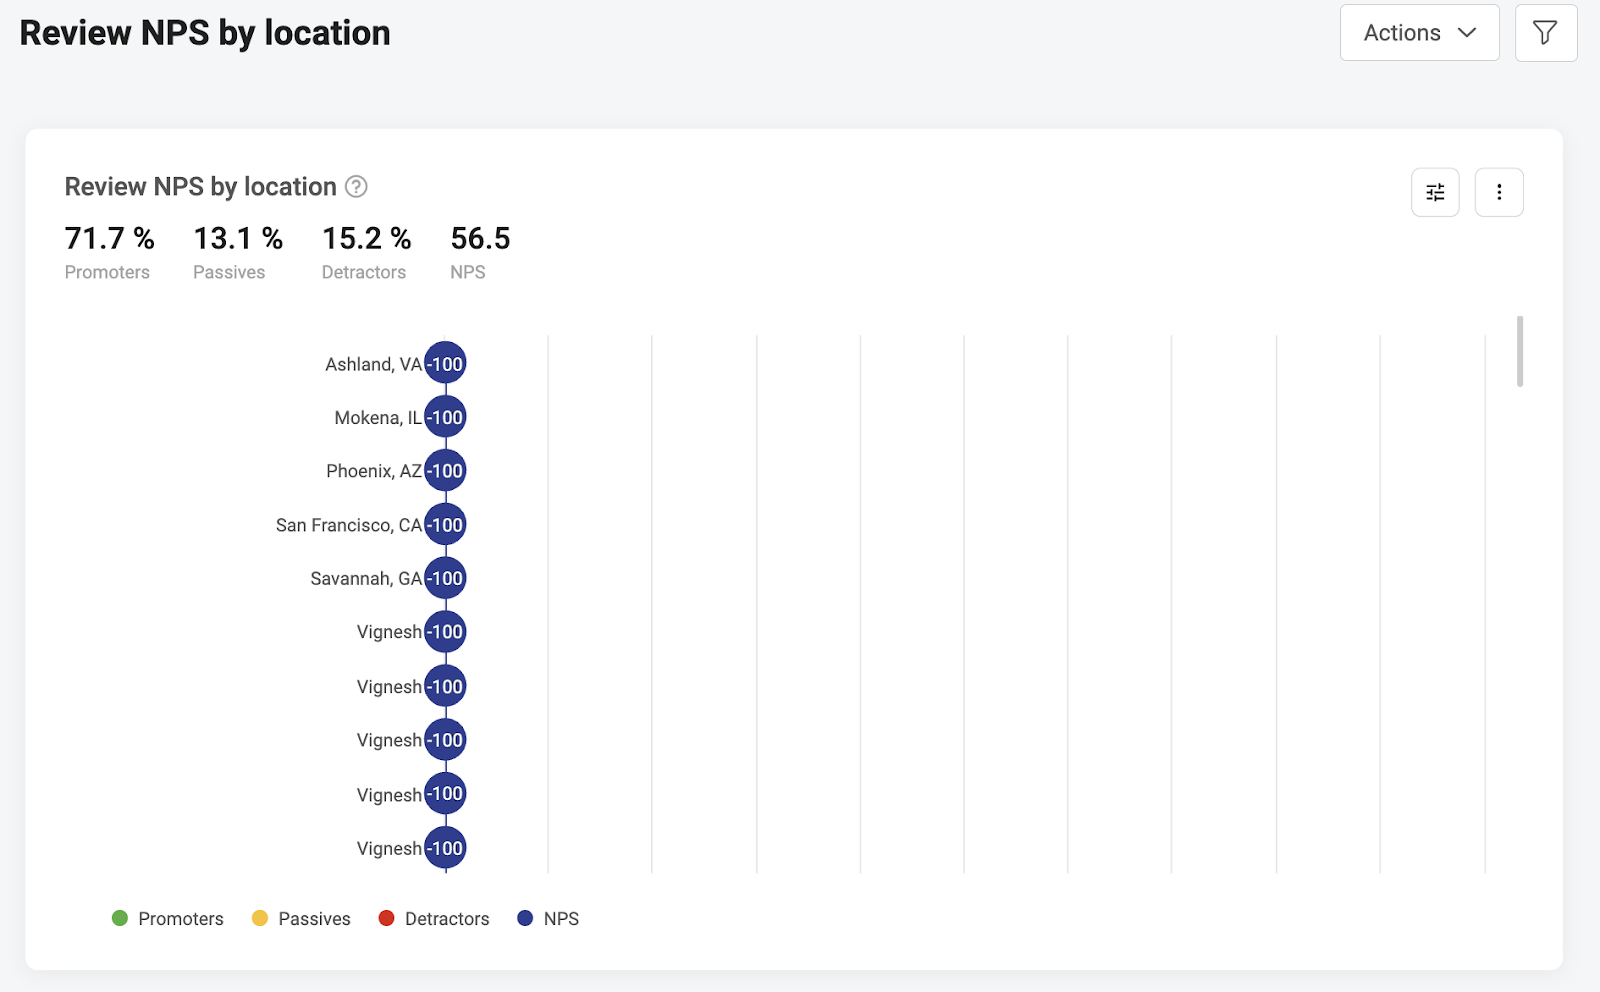
Review NPS by Location
The 'NPS by locations' report displays the sentiment summary for any selected location. If you'd like to view the report for a particular location, you can just hover over the graph. You can view the 'Promoters, Passives, Detractors and NPS’ data in terms of 'Count' and 'Percentage'.
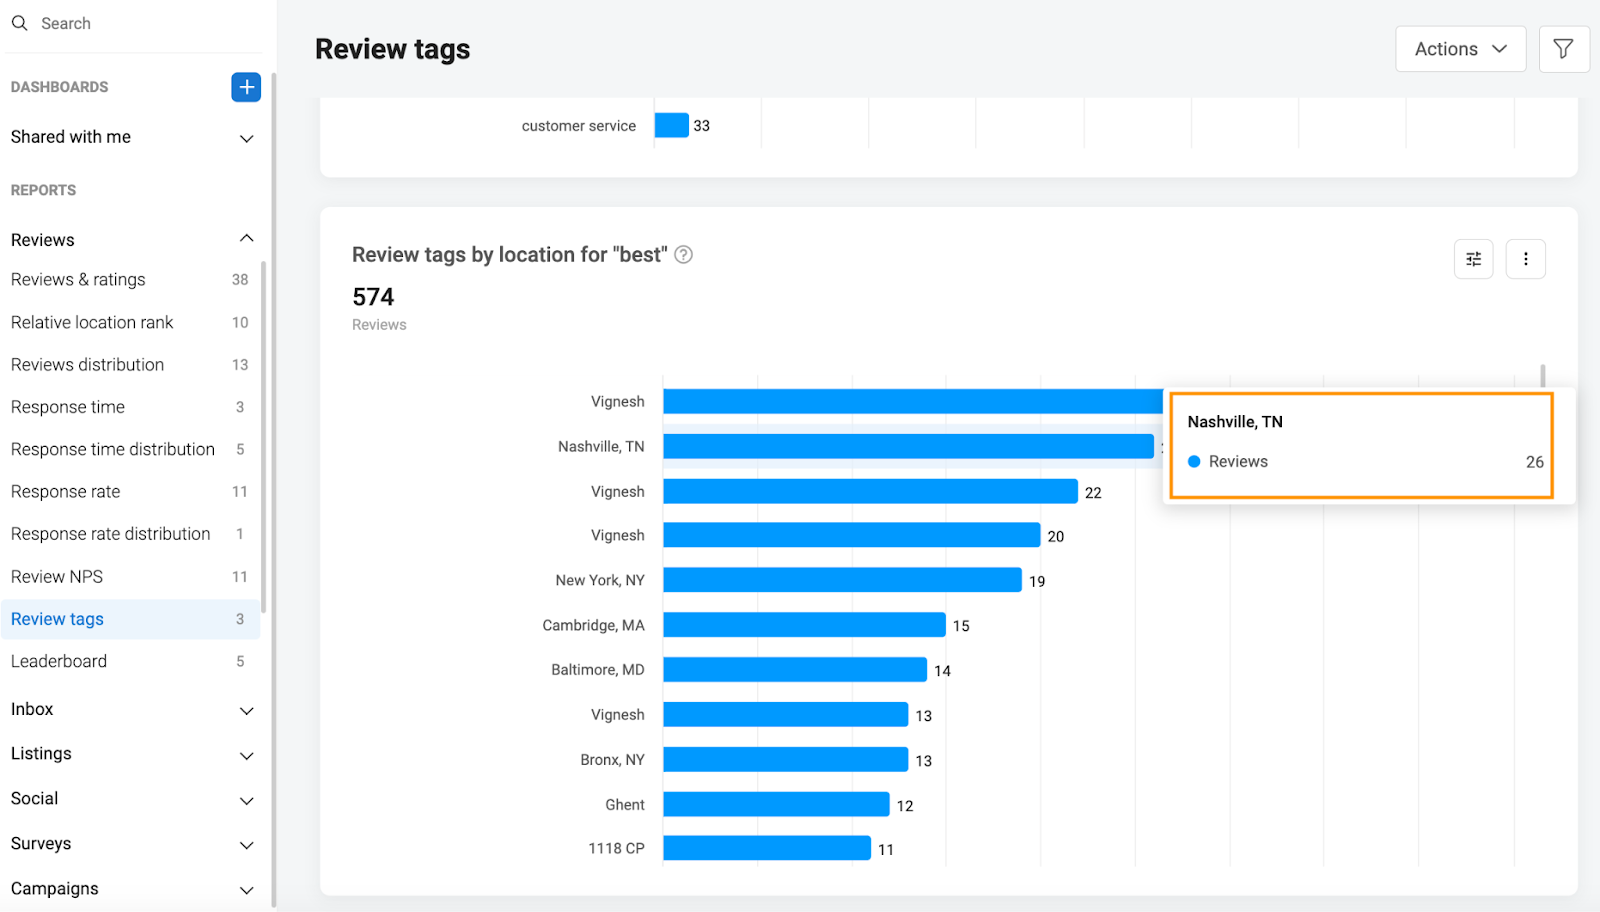
Review Tags
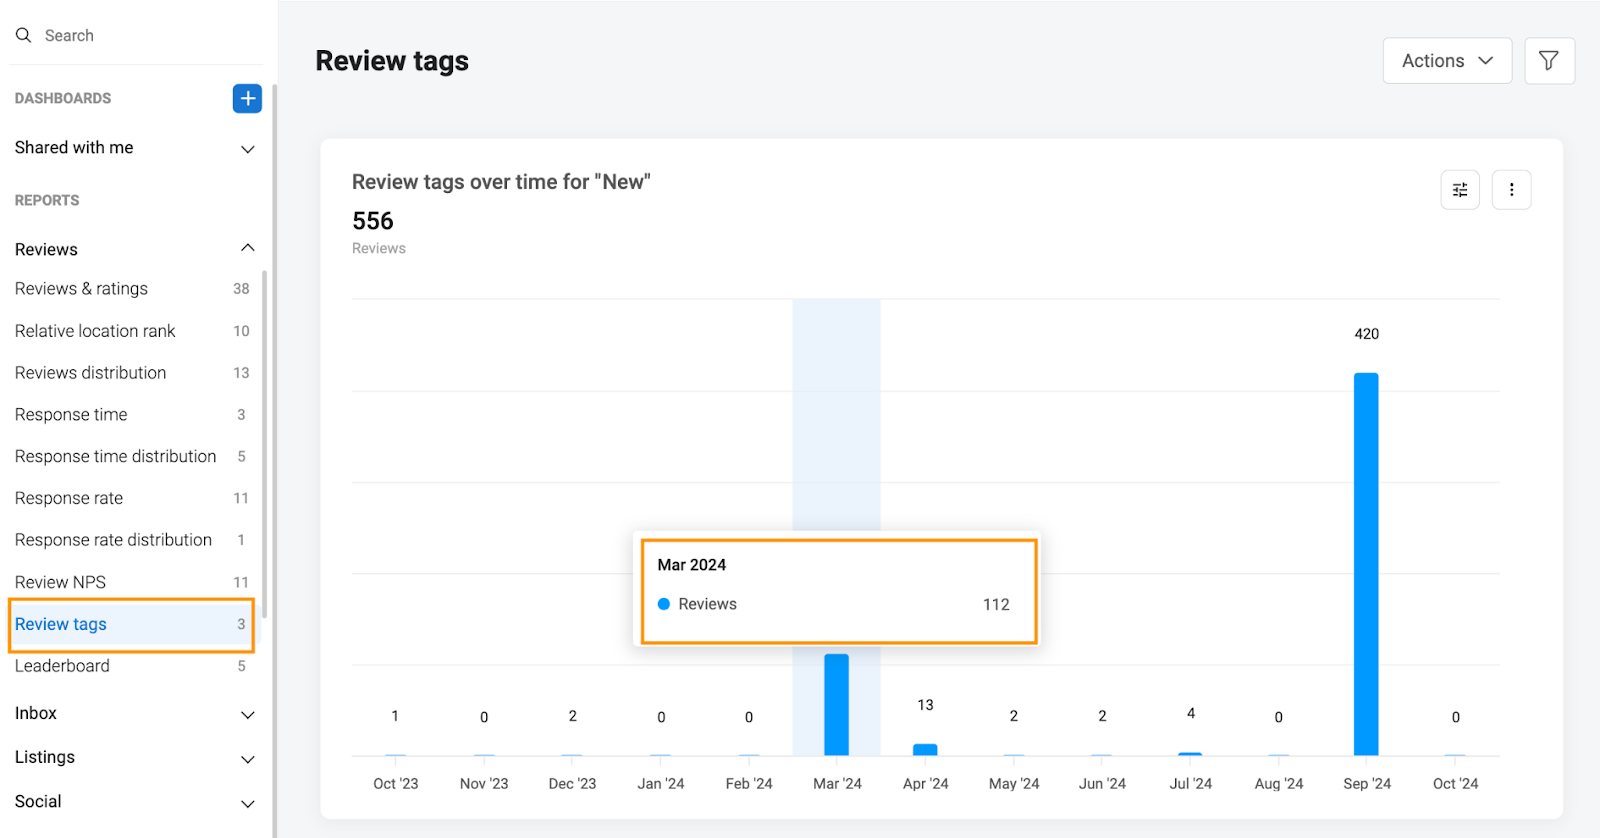
The ‘Review tags’ reports are sorted into three categories: 'Over time', 'By count', and 'By location.'
The 'Over time' option allows you to view the tag data aggregated over time. When you select a tag and hover over a bar on the graph, you can view the number of reviews the tag is associated with over a particular period of time.
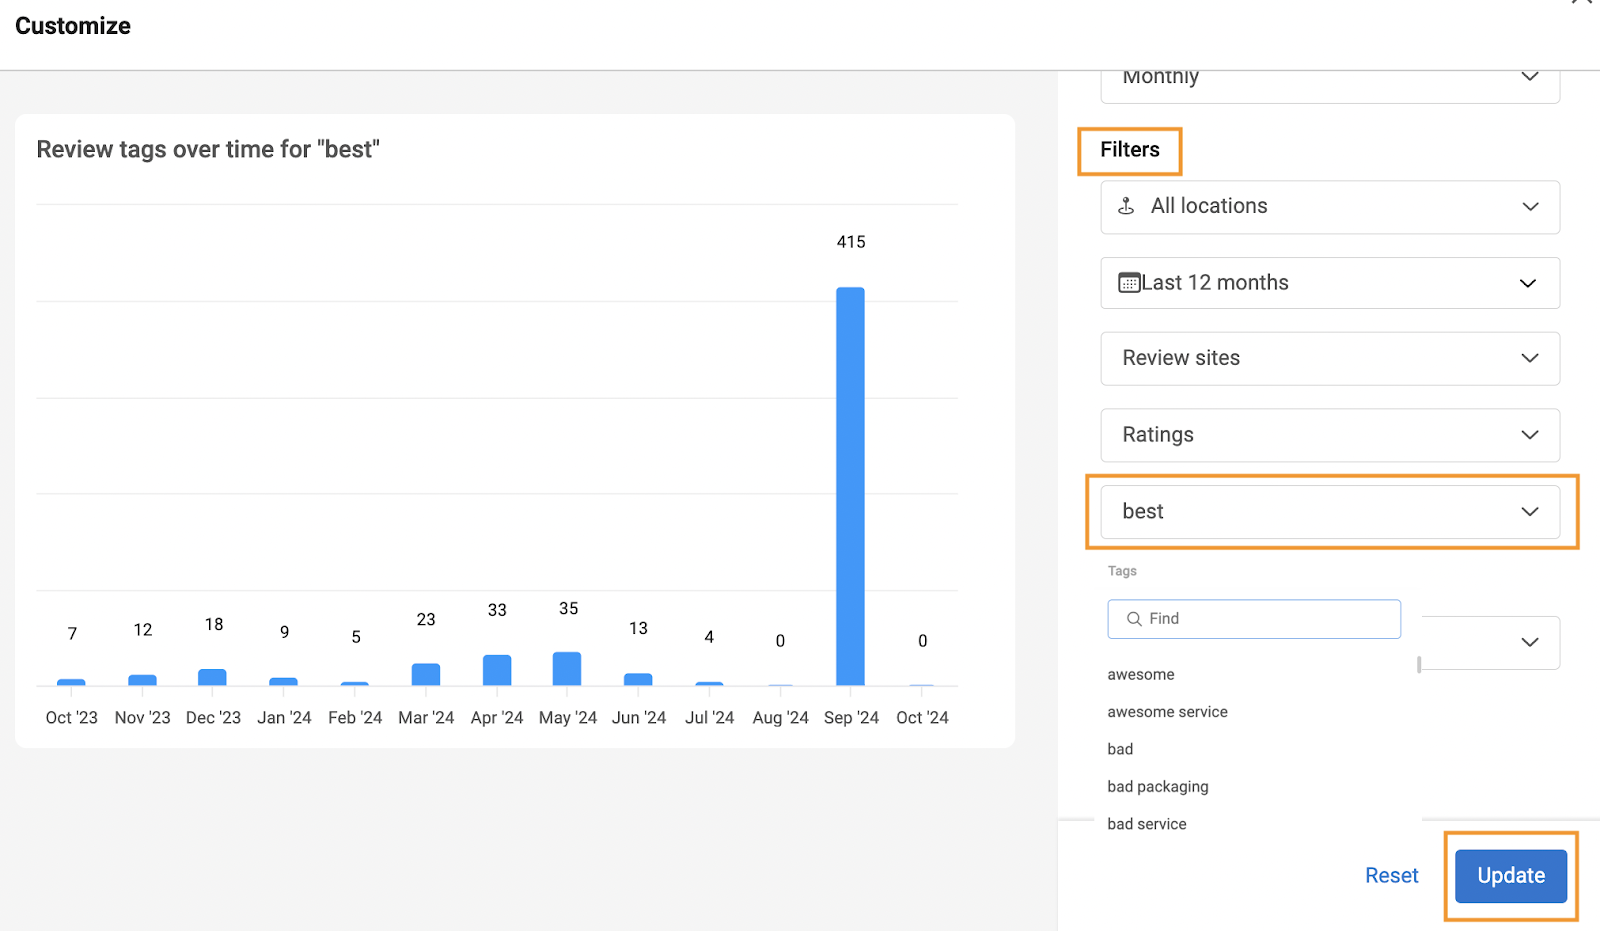
To select a tag, click the ‘Customize’ icon and select the last section under ‘Filters.’ After selecting the tag, click ‘Update.’
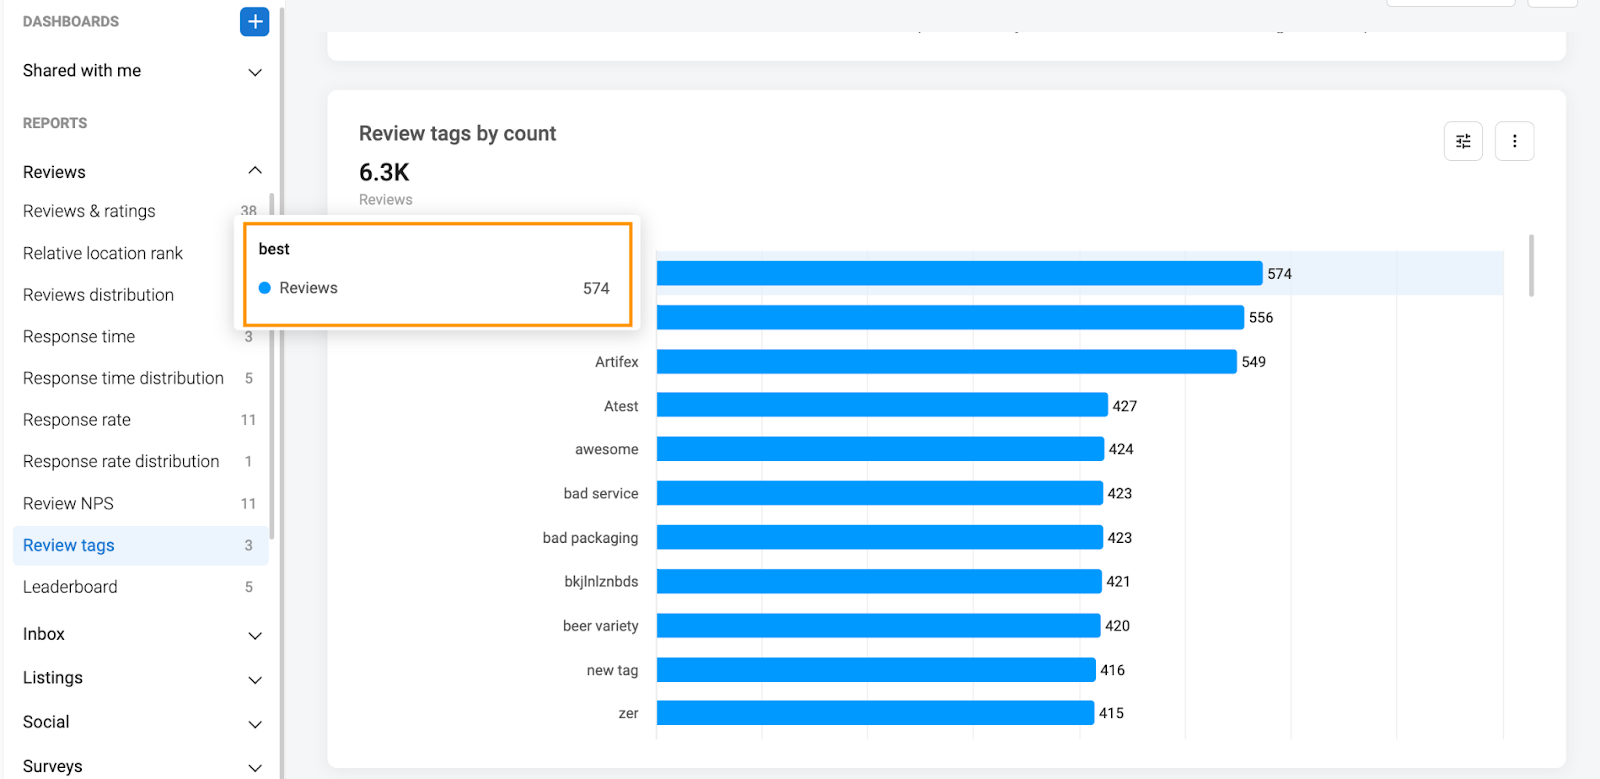
The 'Tag by count' report shows the number of reviews a tag is associated with. You can also hover over the desired tag bar to view the review count.
The 'Tag by location' report shows the number of reviews associated with a particular tag at a given location and is available for enterprise accounts only. You can also hover over the desired location’s bar to view the review count for that particular location.
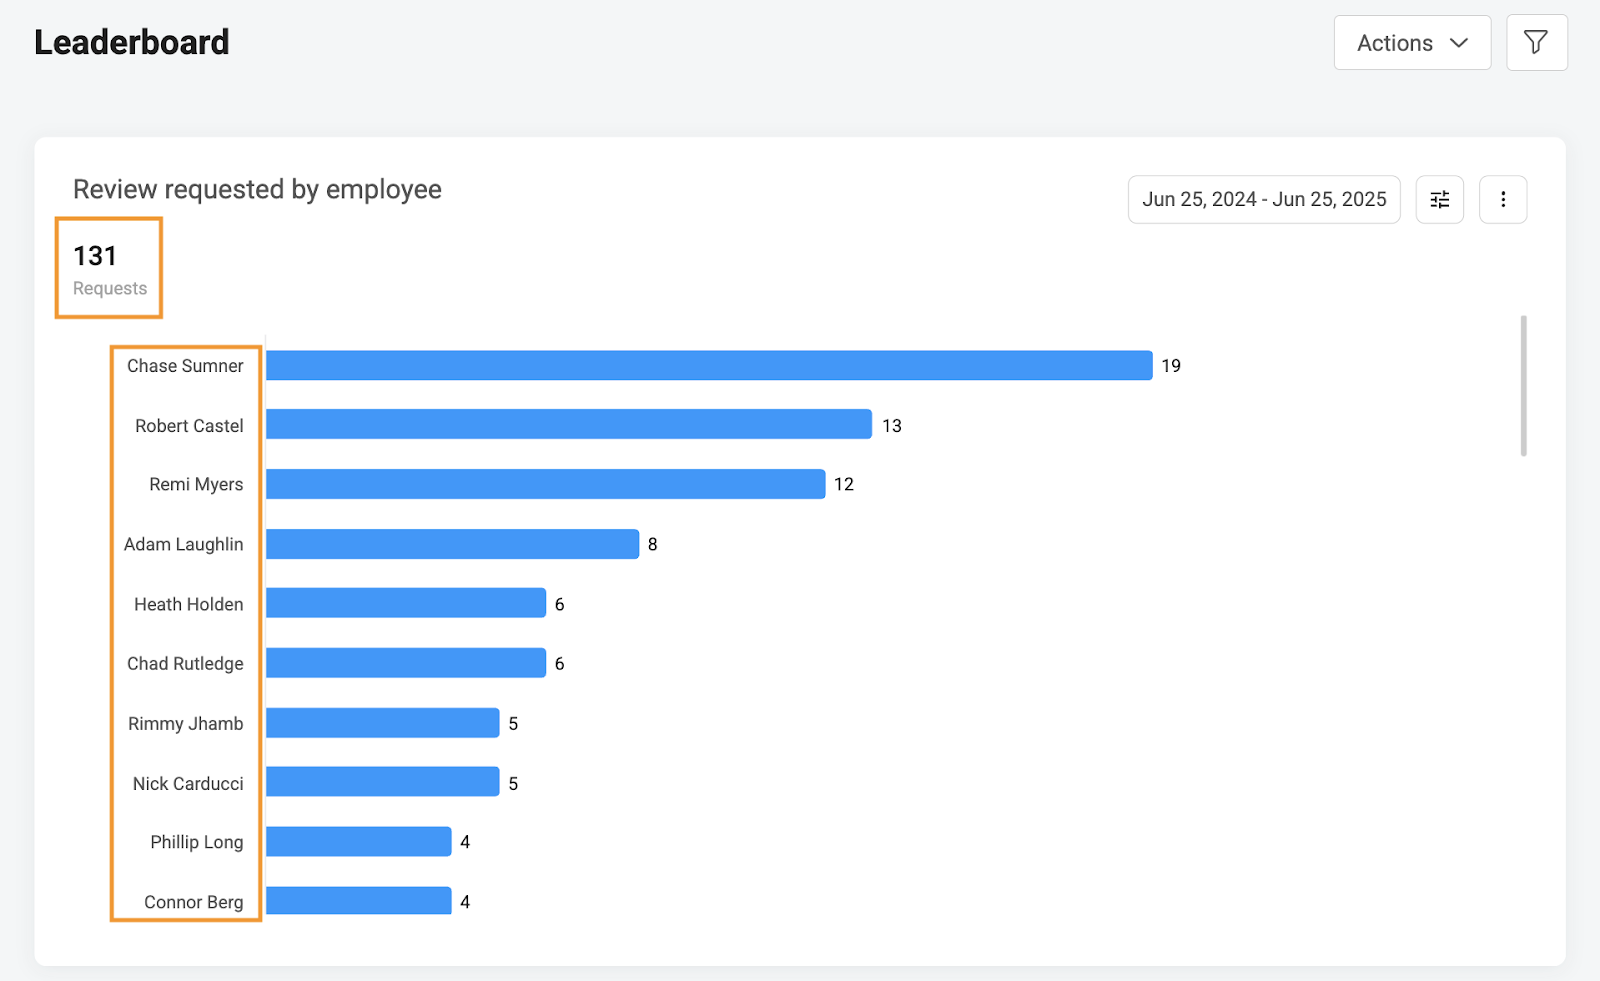
Leaderboard
Review requested by employee
View the total number of review requests sent by employees, along with a breakdown showing how many each employee sent, listed by name.
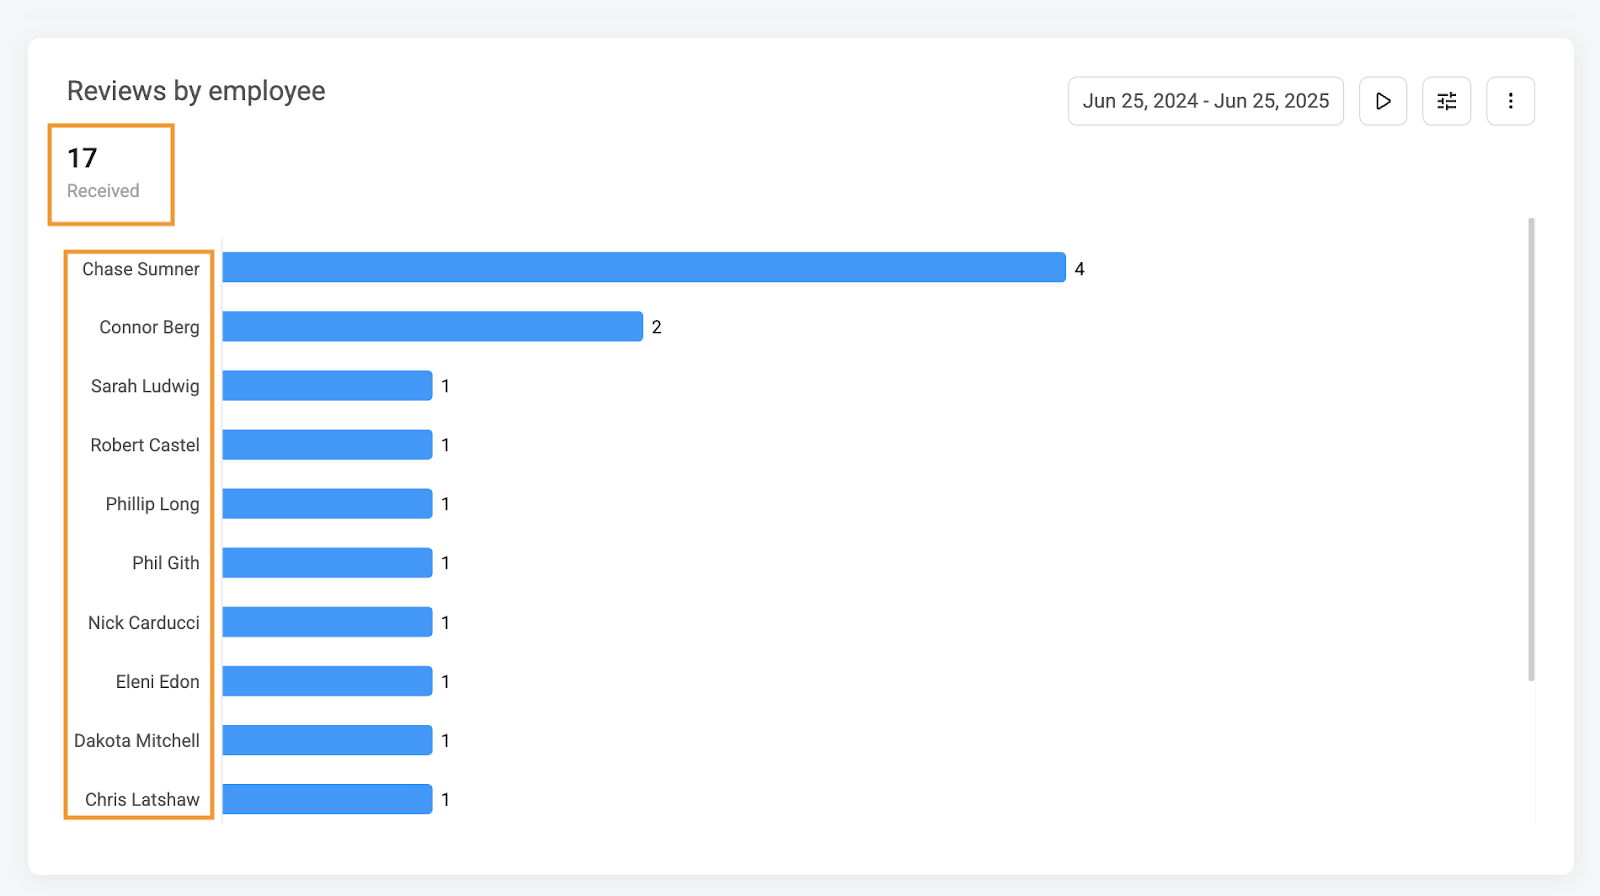
Reviews by employee
View the total number of reviews received across all employees, along with a breakdown of reviews received by each individual employee.
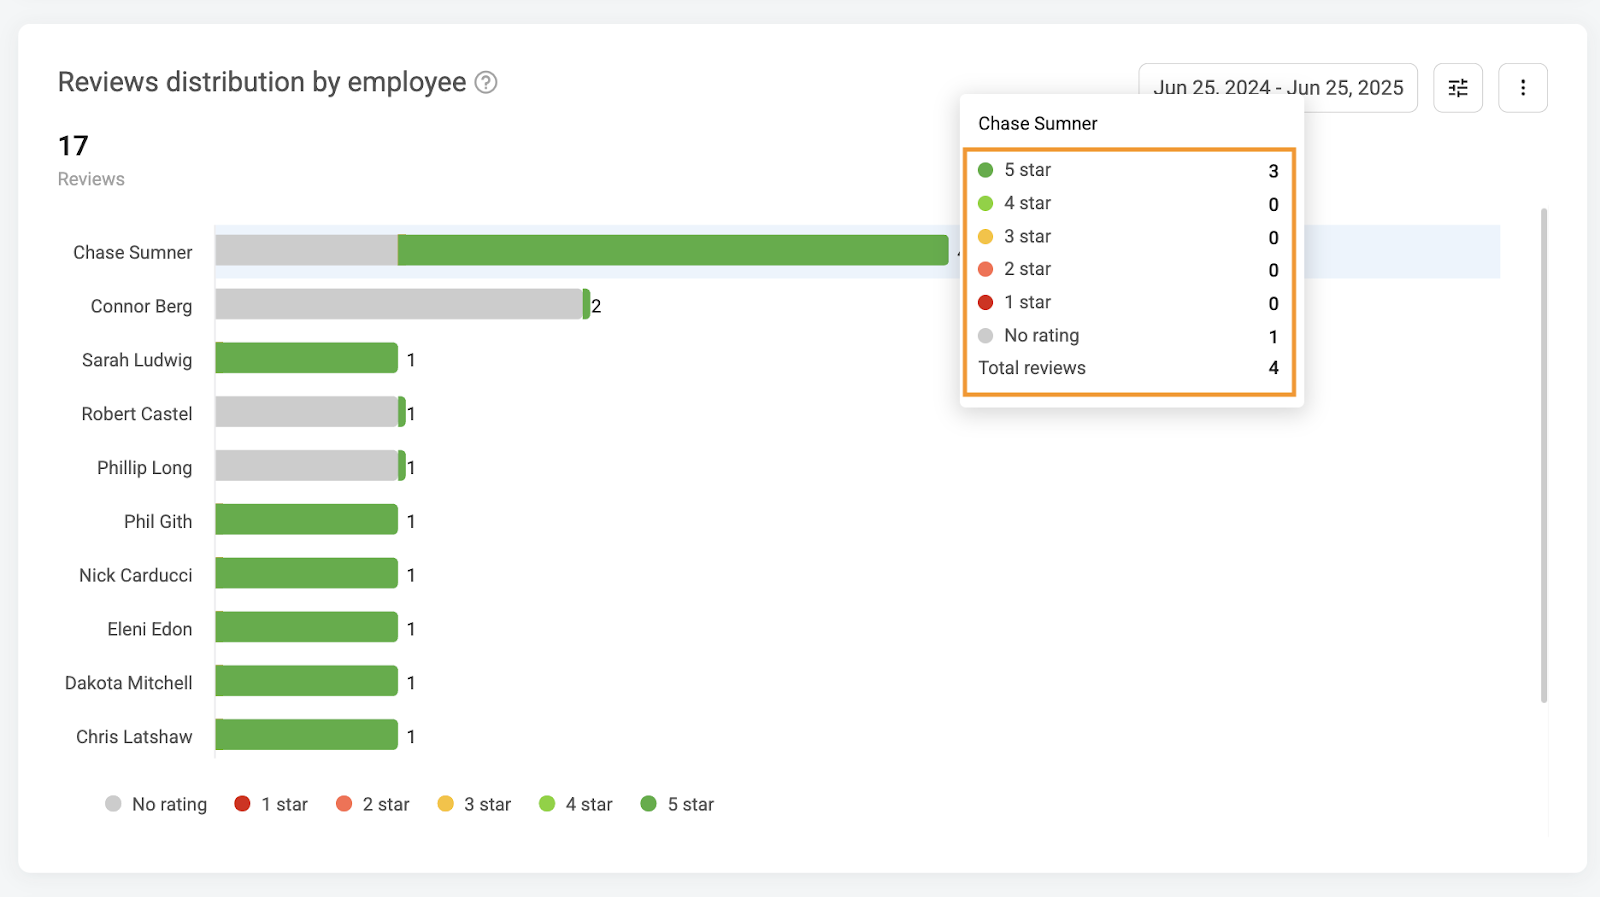
Reviews Distribution By Employee
It shows the total number of reviews received by employees and is broken down by each employee, reviews distributed based on the star ratings—5, 4, 3, 2, and 1 stars—as well as reviews with no rating received by each employee.
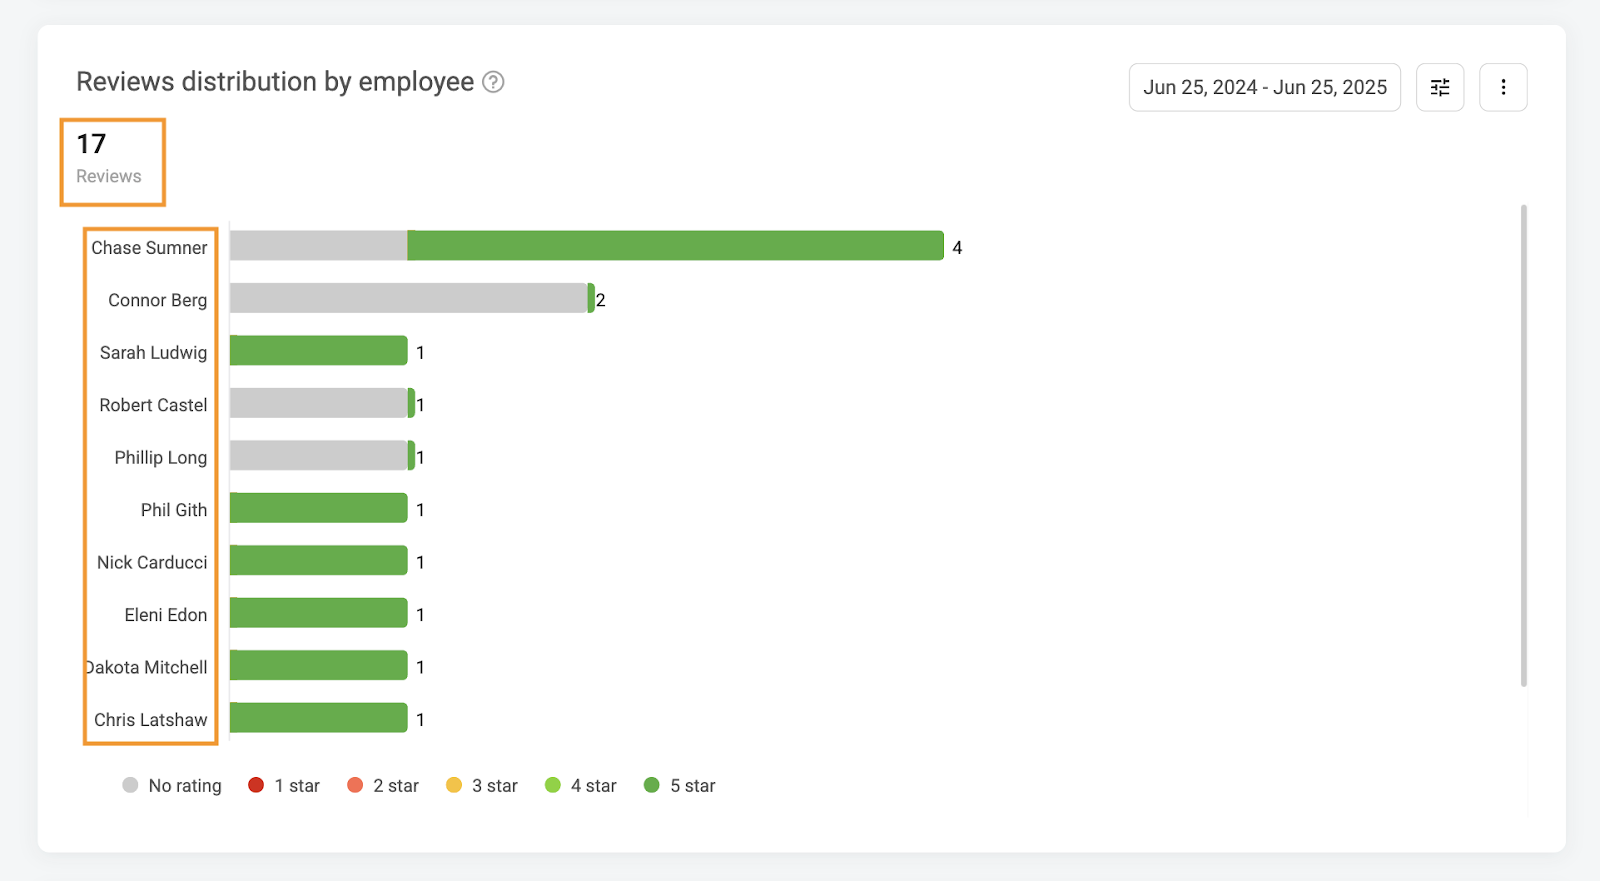
Hover over the bar to view the total number of 5,4,3,2,1 stars and no ratings received by an employee.
NOTE:
No rating represents text reviews without a rating, as well as ‘Recommended’ and ‘Not Recommended’ reviews on Facebook.
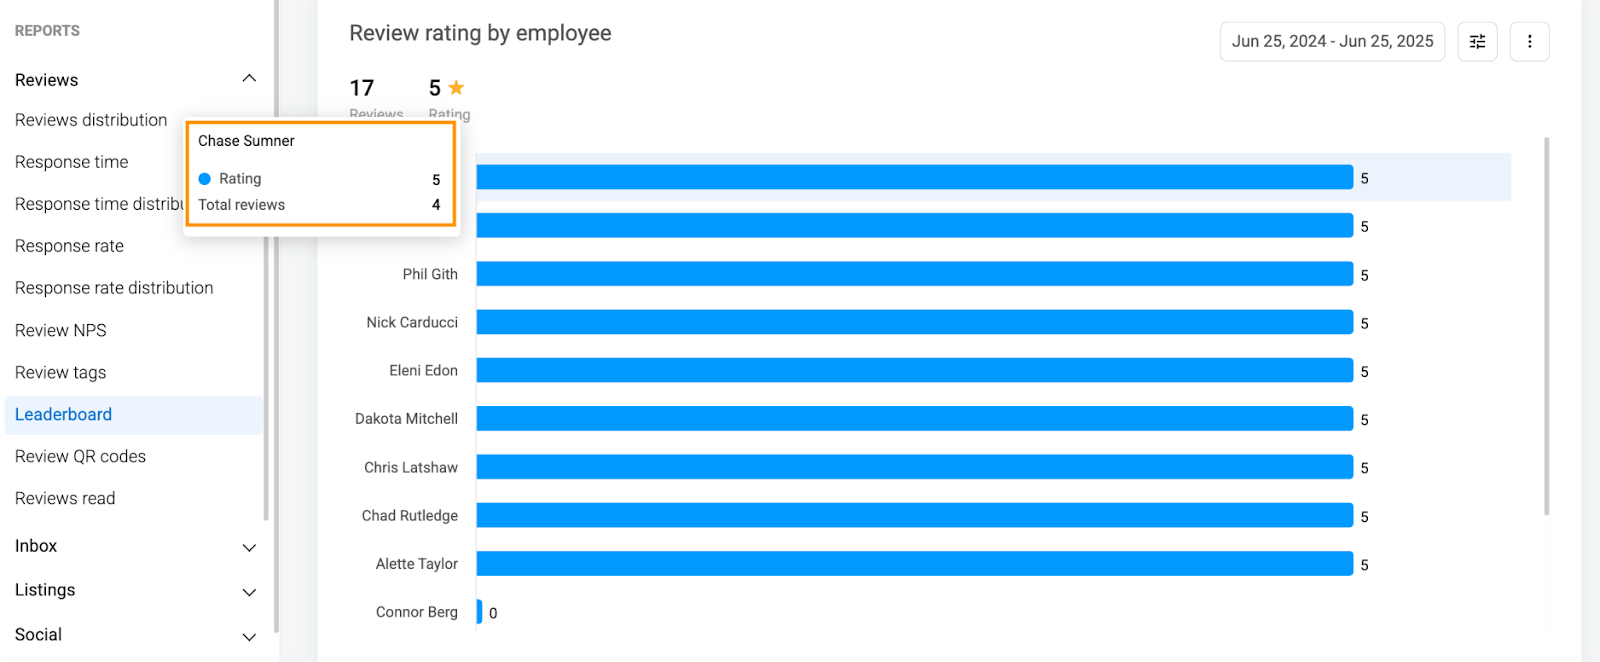
Review Rating By Employee
It shows a total number of reviews received during this period, with an overall average rating for every employee.
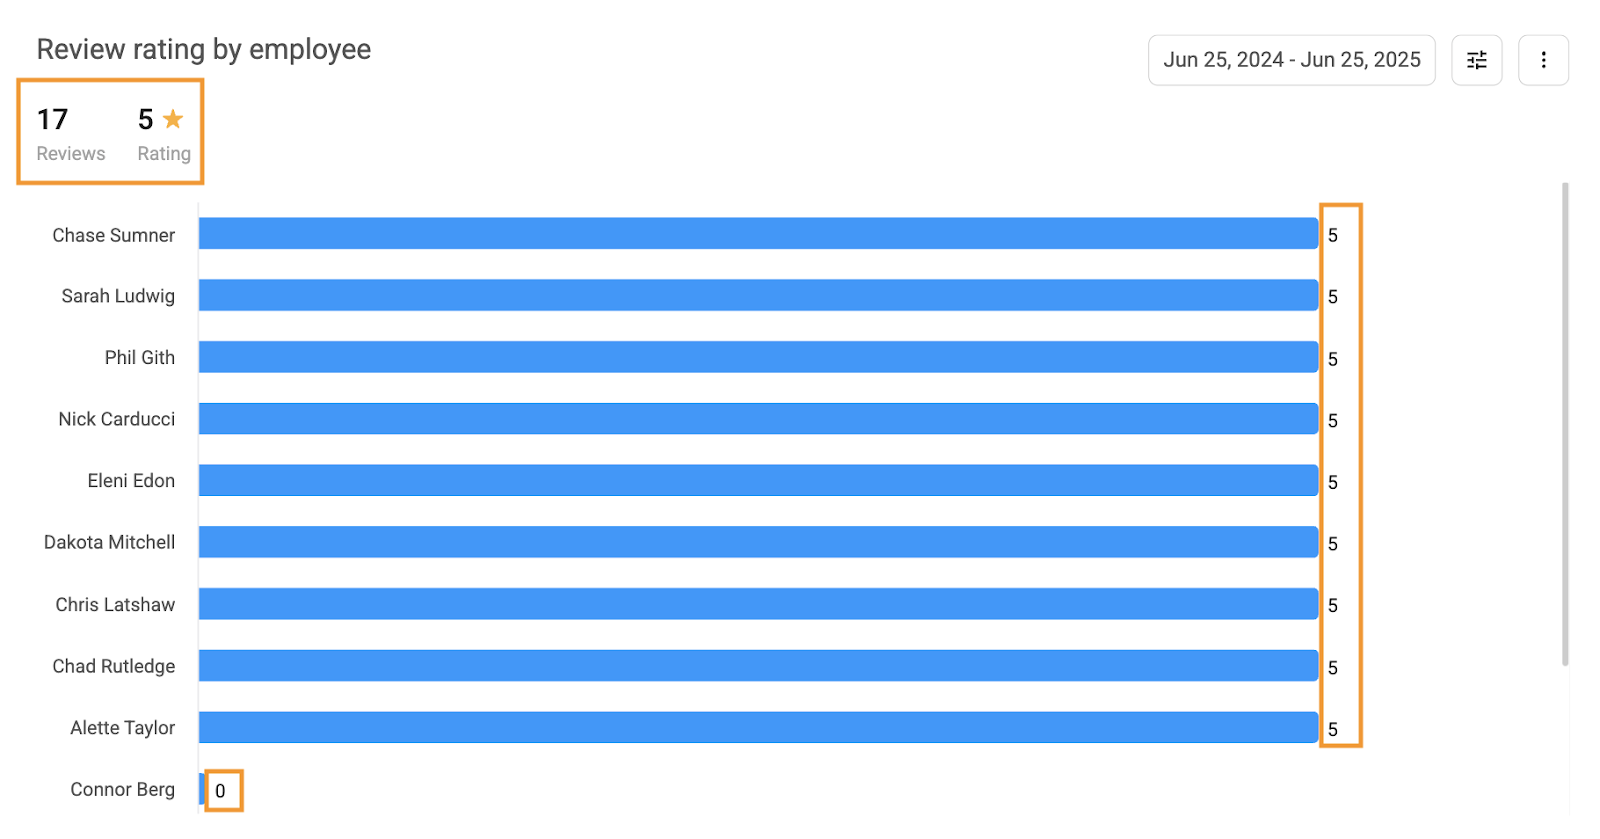
Hover over the bar to view the total number of reviews received by an employee and their average rating.
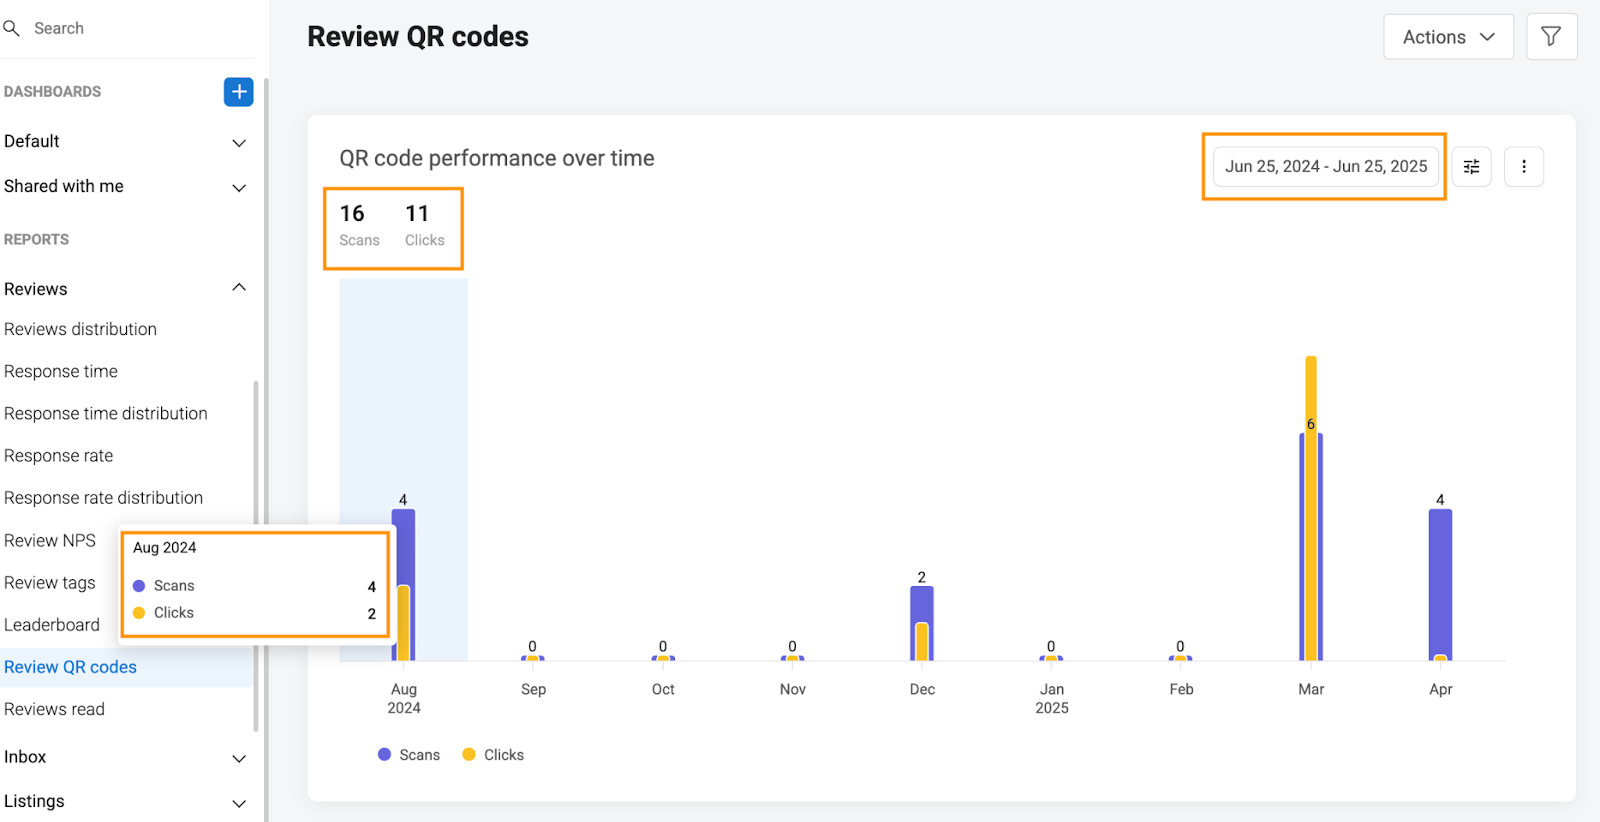
Review QR Codes
QR Code Performance Over Time
This report helps businesses track the total number of QR code scans and clicks within the selected time period, offering insights into customer engagement and campaign performance.
To get detailed data for any period, hover over the bar.
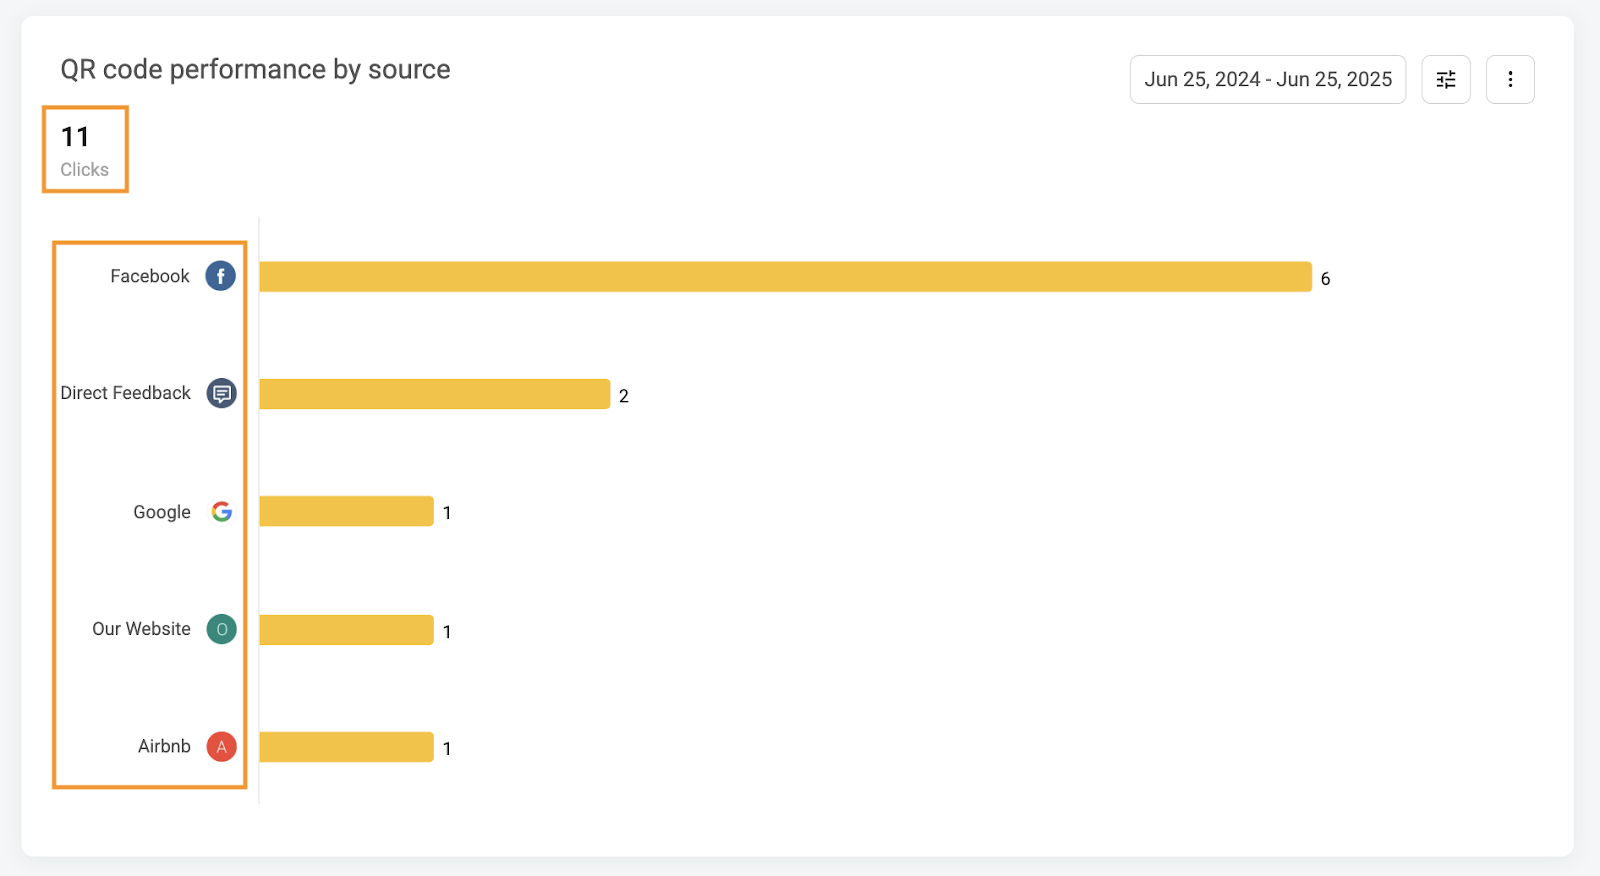
QR Code Performance By Source
It shows the number of scans or submissions received from each source—such as Google, your website, Facebook, Direct feedback, Airbnb, etc. —helping you understand which channels are driving the most engagement through QR codes.
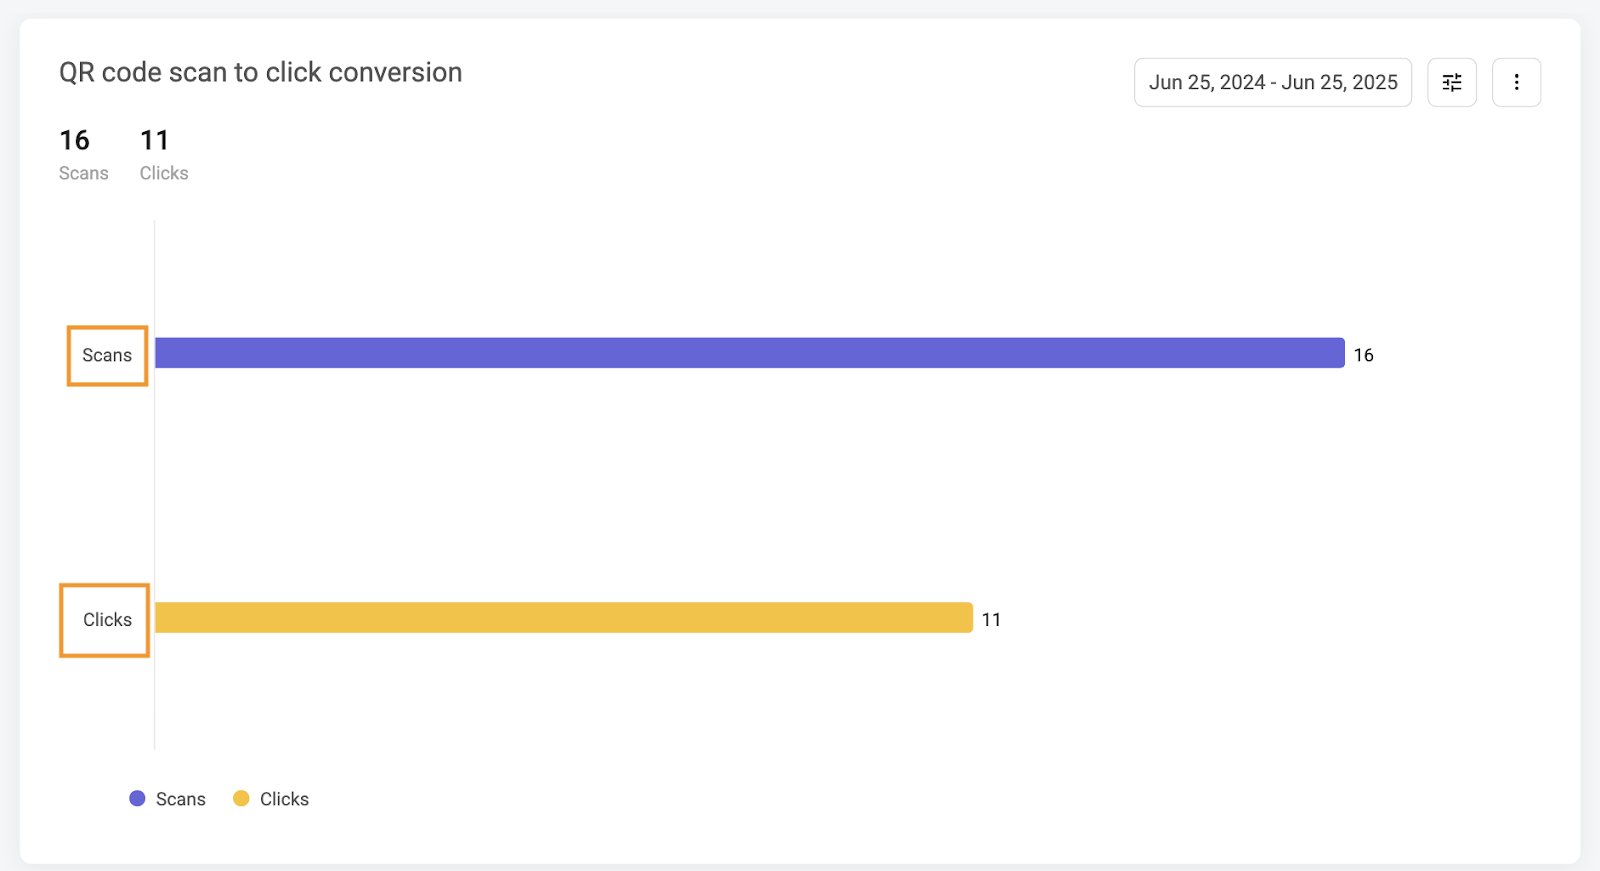
QR Code Scan To Click Conversion
Displays how many times the QR code was scanned and how many of those scans resulted in clicks, helping measure engagement effectiveness.
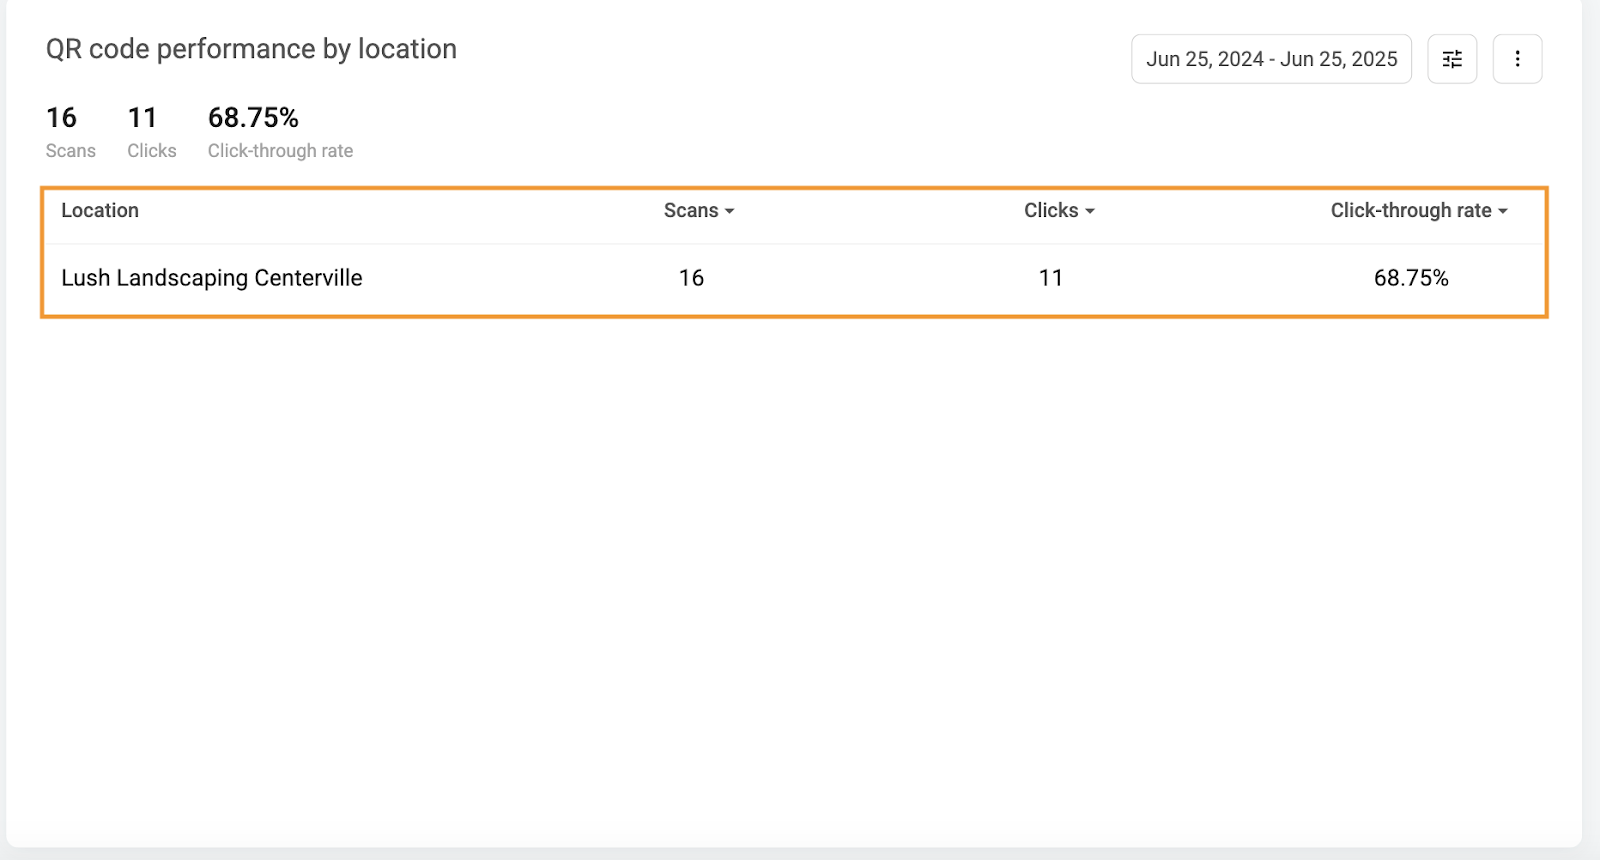
QR Code Performance By Location
Shows the number of scans, clicks, and click-through rate for each business location, helping identify which locations are driving the most engagement. The image below displays data for a single location. If you have multiple locations with scans and clicks, data for each will also be shown here.